| __timestamp | Intra-Cellular Therapies, Inc. | Vertex Pharmaceuticals Incorporated |
|---|---|---|
| Wednesday, January 1, 2014 | 10337679 | 305409000 |
| Thursday, January 1, 2015 | 18187286 | 377080000 |
| Friday, January 1, 2016 | 24758063 | 432829000 |
| Sunday, January 1, 2017 | 23666957 | 496079000 |
| Monday, January 1, 2018 | 30099855 | 557616000 |
| Tuesday, January 1, 2019 | 64947625 | 658498000 |
| Wednesday, January 1, 2020 | 186363444 | 770456000 |
| Friday, January 1, 2021 | 272611040 | 840100000 |
| Saturday, January 1, 2022 | 358782000 | 944700000 |
| Sunday, January 1, 2023 | 409864000 | 1136600000 |
| Monday, January 1, 2024 | 1464300000 |
Unleashing insights
Over the past decade, the biopharmaceutical industry has witnessed significant shifts in operational costs, particularly in Selling, General, and Administrative (SG&A) expenses. This analysis focuses on two key players: Vertex Pharmaceuticals and Intra-Cellular Therapies.
From 2014 to 2023, Vertex Pharmaceuticals consistently outpaced Intra-Cellular Therapies in SG&A spending, reflecting its expansive market reach and robust operational strategies. In 2023, Vertex's SG&A expenses soared to over $1.1 billion, marking a 270% increase from 2014. In contrast, Intra-Cellular Therapies, while smaller in scale, demonstrated a remarkable growth trajectory, with SG&A expenses rising by nearly 3,900% over the same period.
This stark contrast underscores the diverse strategies employed by these companies in navigating the competitive landscape of biopharma, with Vertex leveraging its established market position and Intra-Cellular Therapies focusing on aggressive growth and expansion.
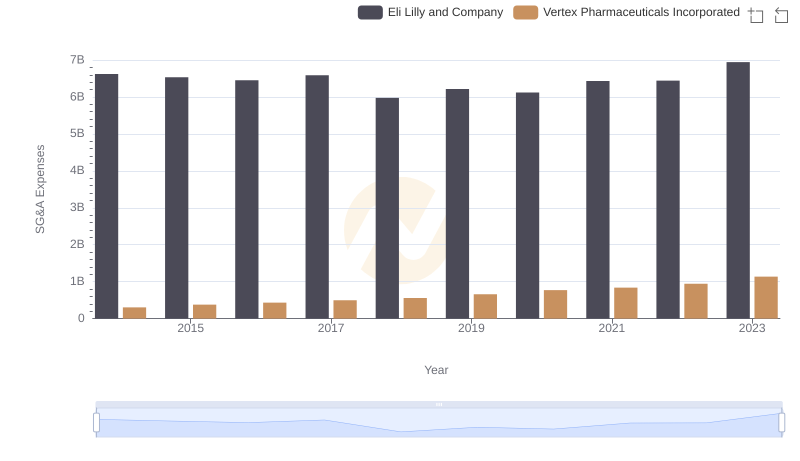
Eli Lilly and Company and Vertex Pharmaceuticals Incorporated: SG&A Spending Patterns Compared
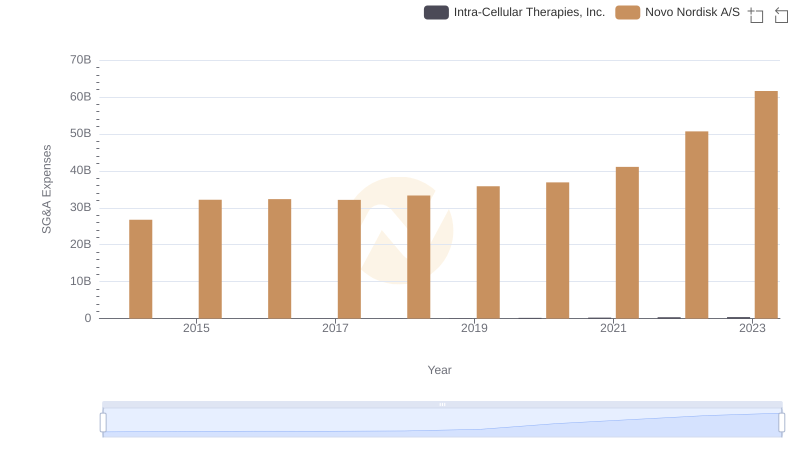
Cost Management Insights: SG&A Expenses for Novo Nordisk A/S and Intra-Cellular Therapies, Inc.
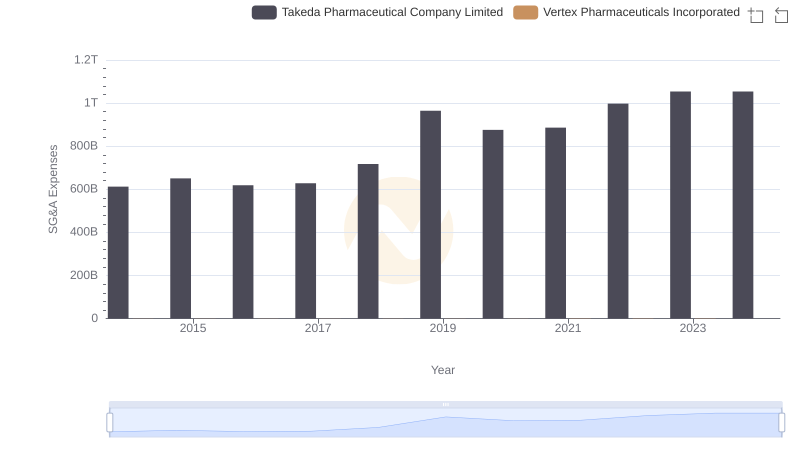
Comparing SG&A Expenses: Vertex Pharmaceuticals Incorporated vs Takeda Pharmaceutical Company Limited Trends and Insights
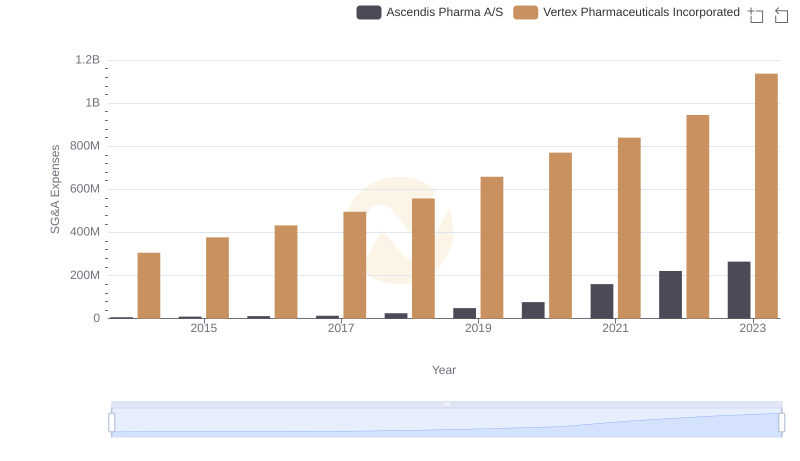
Vertex Pharmaceuticals Incorporated or Ascendis Pharma A/S: Who Manages SG&A Costs Better?

Vertex Pharmaceuticals Incorporated and Cytokinetics, Incorporated: SG&A Spending Patterns Compared
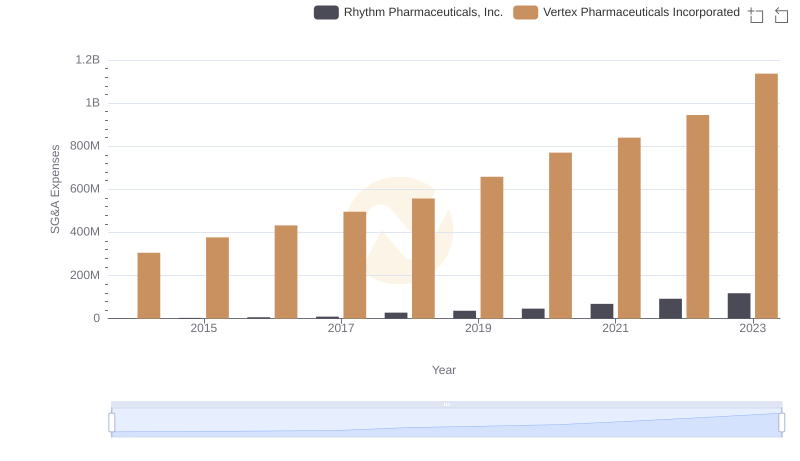
Breaking Down SG&A Expenses: Vertex Pharmaceuticals Incorporated vs Rhythm Pharmaceuticals, Inc.
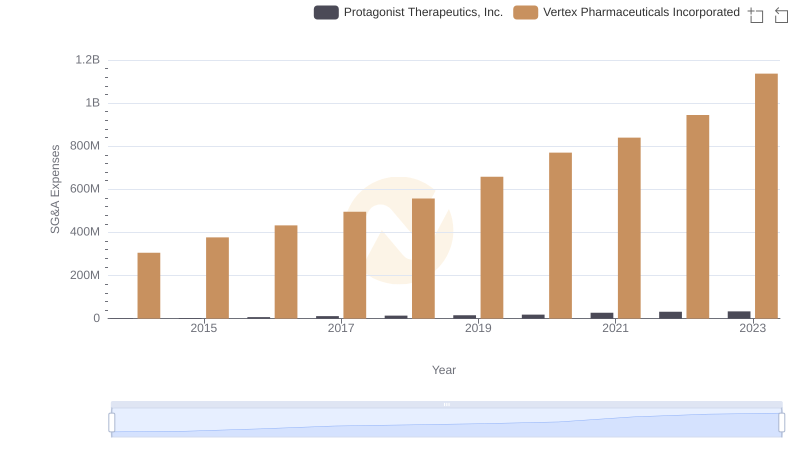
Vertex Pharmaceuticals Incorporated or Protagonist Therapeutics, Inc.: Who Manages SG&A Costs Better?
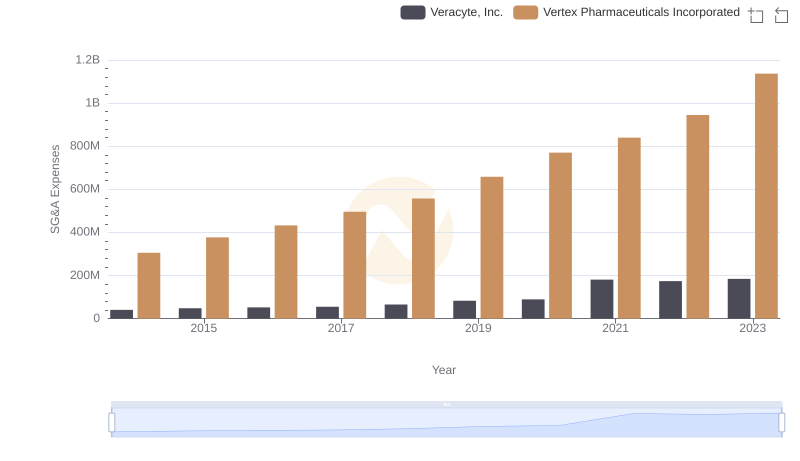
Operational Costs Compared: SG&A Analysis of Vertex Pharmaceuticals Incorporated and Veracyte, Inc.
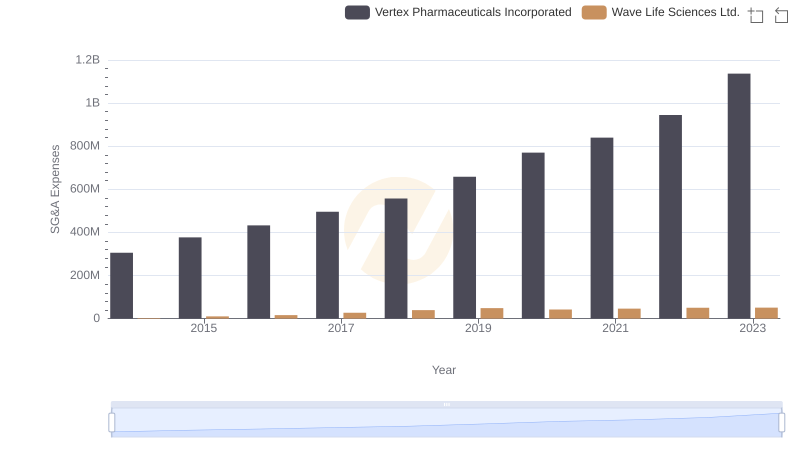
Vertex Pharmaceuticals Incorporated vs Wave Life Sciences Ltd.: SG&A Expense Trends
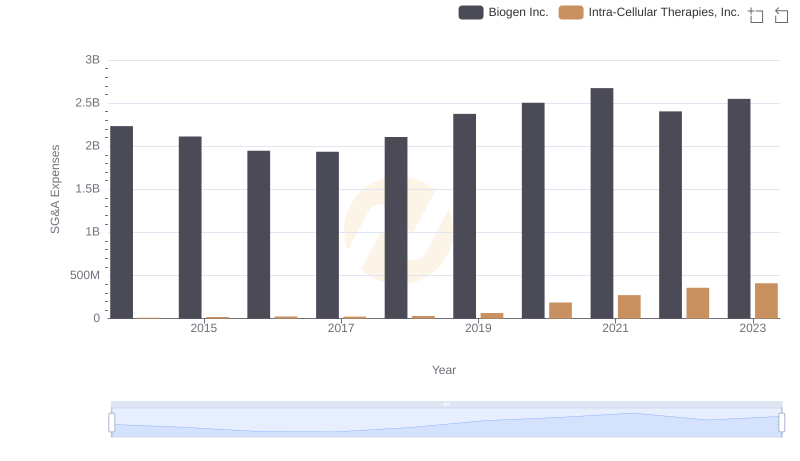
Biogen Inc. vs Intra-Cellular Therapies, Inc.: SG&A Expense Trends
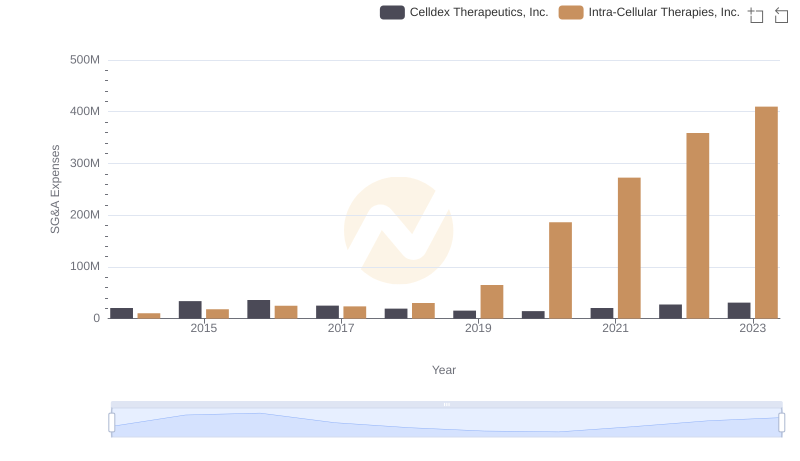
Intra-Cellular Therapies, Inc. and Celldex Therapeutics, Inc.: SG&A Spending Patterns Compared
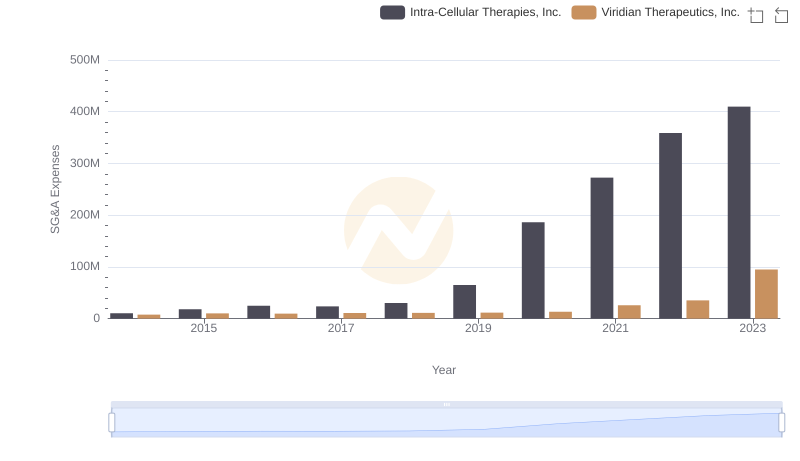
Comparing SG&A Expenses: Intra-Cellular Therapies, Inc. vs Viridian Therapeutics, Inc. Trends and Insights