| __timestamp | Nutanix, Inc. | SAP SE |
|---|---|---|
| Wednesday, January 1, 2014 | 106497000 | 5195000000 |
| Thursday, January 1, 2015 | 185728000 | 6449000000 |
| Friday, January 1, 2016 | 322758000 | 7299000000 |
| Sunday, January 1, 2017 | 577870000 | 7999000000 |
| Monday, January 1, 2018 | 736058000 | 7879000000 |
| Tuesday, January 1, 2019 | 1029337000 | 9318000000 |
| Wednesday, January 1, 2020 | 1295936000 | 8461000000 |
| Friday, January 1, 2021 | 1206290000 | 9936000000 |
| Saturday, January 1, 2022 | 1145122000 | 11015000000 |
| Sunday, January 1, 2023 | 1156897000 | 10192000000 |
| Monday, January 1, 2024 | 1178149000 | 10254000000 |
Data in motion
In the ever-evolving tech industry, operational efficiency is key. Over the past decade, SAP SE and Nutanix, Inc. have showcased contrasting strategies in managing their Selling, General, and Administrative (SG&A) expenses. While SAP SE, a giant in enterprise software, consistently maintained SG&A expenses around 80% of its revenue, Nutanix, Inc., a cloud computing leader, saw a dramatic rise, peaking at over 1.2 billion USD in 2020, a tenfold increase since 2014.
This analysis highlights the diverse approaches of established and emerging tech firms in balancing growth and operational costs.
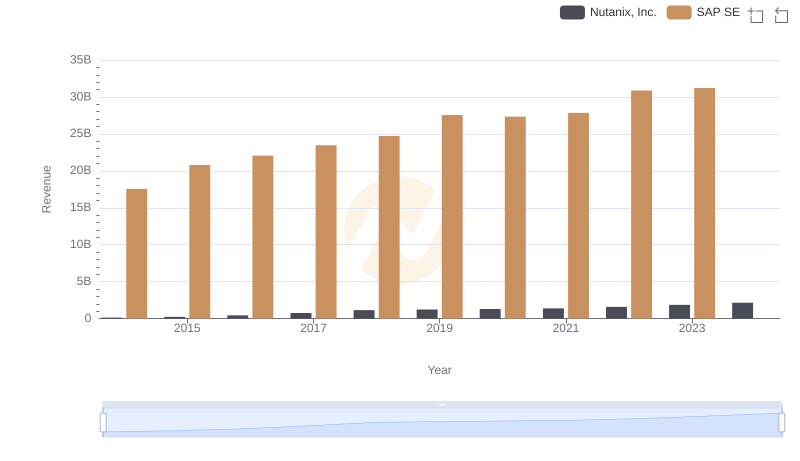
Breaking Down Revenue Trends: SAP SE vs Nutanix, Inc.
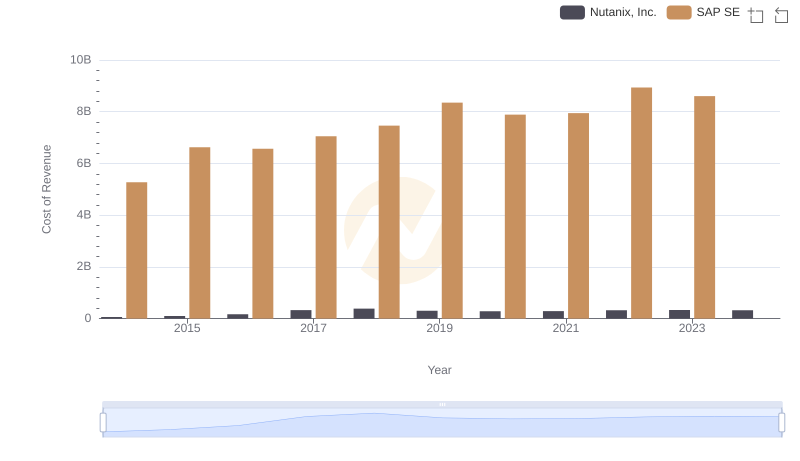
Cost Insights: Breaking Down SAP SE and Nutanix, Inc.'s Expenses
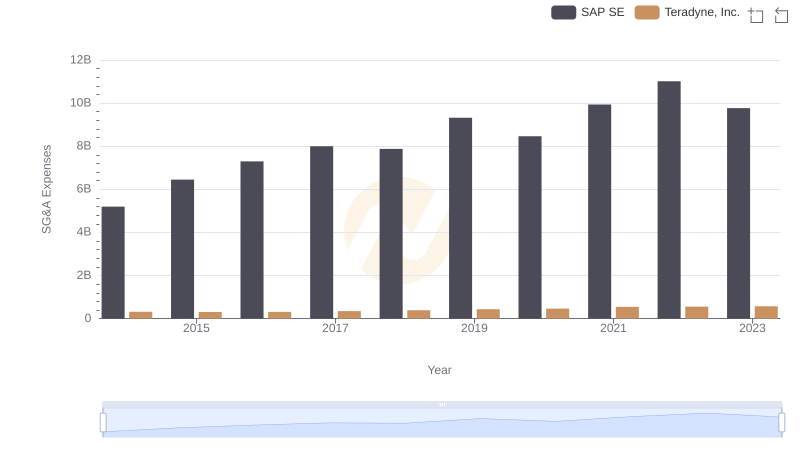
Operational Costs Compared: SG&A Analysis of SAP SE and Teradyne, Inc.
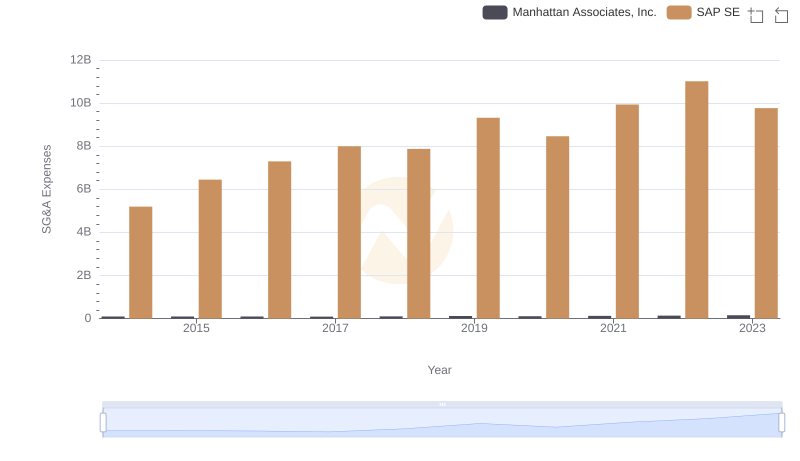
Cost Management Insights: SG&A Expenses for SAP SE and Manhattan Associates, Inc.
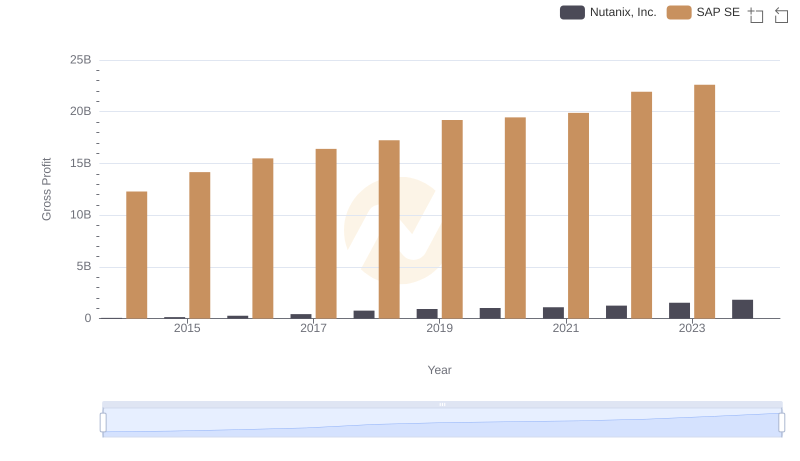
Key Insights on Gross Profit: SAP SE vs Nutanix, Inc.
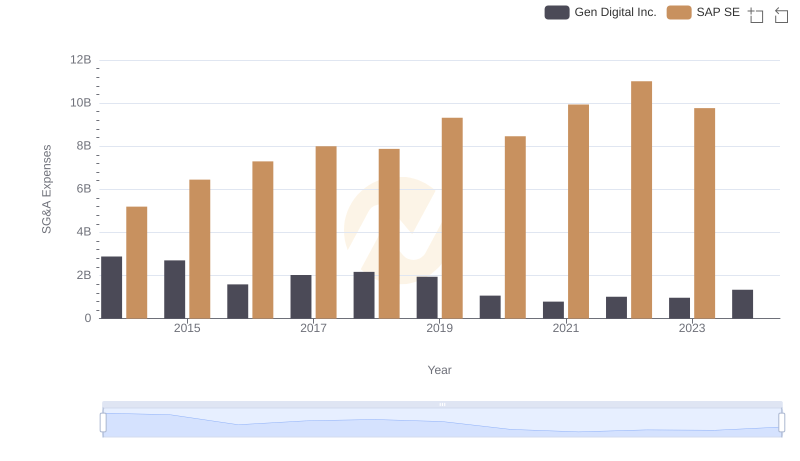
Selling, General, and Administrative Costs: SAP SE vs Gen Digital Inc.
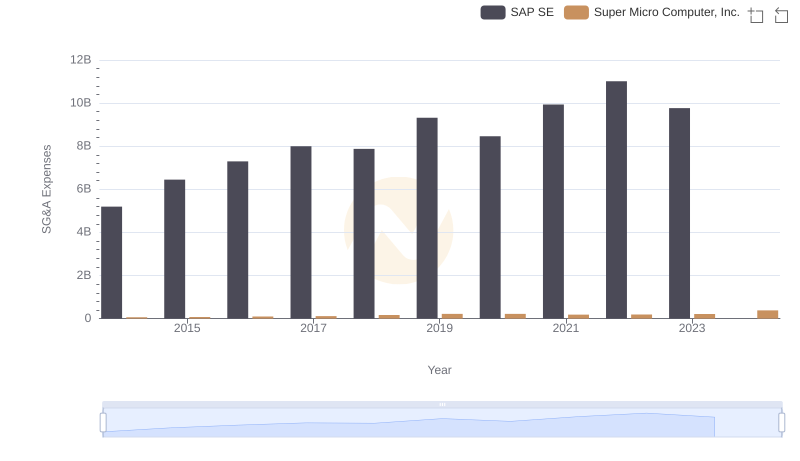
Breaking Down SG&A Expenses: SAP SE vs Super Micro Computer, Inc.
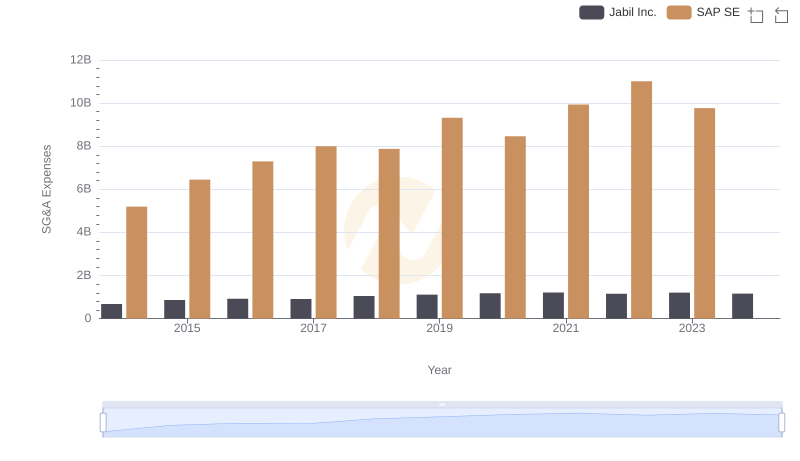
SAP SE or Jabil Inc.: Who Manages SG&A Costs Better?
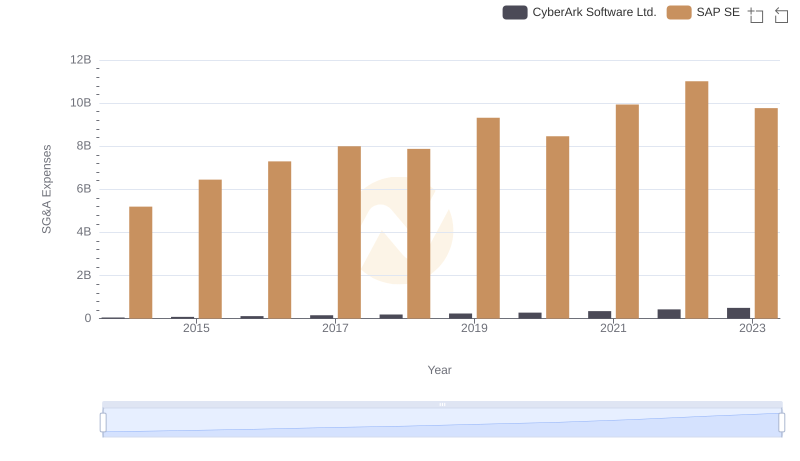
Breaking Down SG&A Expenses: SAP SE vs CyberArk Software Ltd.
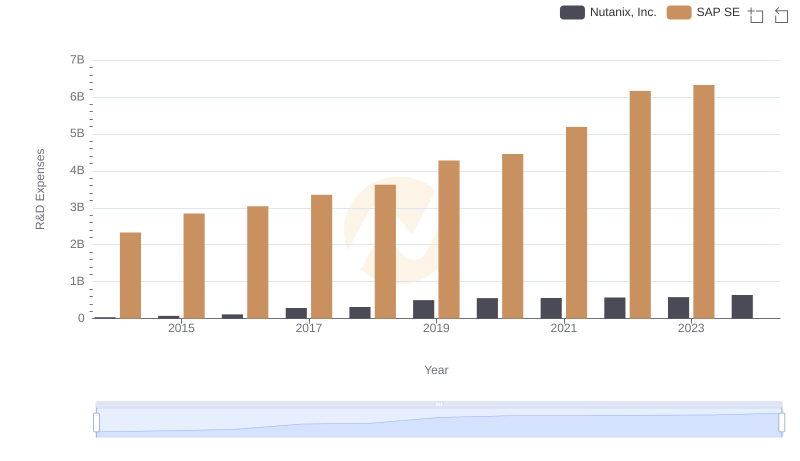
Analyzing R&D Budgets: SAP SE vs Nutanix, Inc.
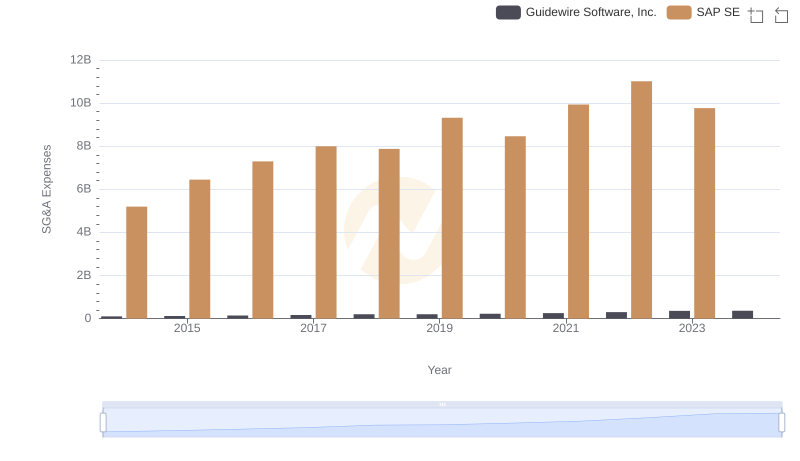
SAP SE and Guidewire Software, Inc.: SG&A Spending Patterns Compared

Comparing SG&A Expenses: SAP SE vs Trimble Inc. Trends and Insights