| __timestamp | Deere & Company | United Rentals, Inc. |
|---|---|---|
| Wednesday, January 1, 2014 | 3284400000 | 758000000 |
| Thursday, January 1, 2015 | 2873300000 | 714000000 |
| Friday, January 1, 2016 | 2763700000 | 719000000 |
| Sunday, January 1, 2017 | 3066600000 | 903000000 |
| Monday, January 1, 2018 | 3455500000 | 1038000000 |
| Tuesday, January 1, 2019 | 3551000000 | 1092000000 |
| Wednesday, January 1, 2020 | 3477000000 | 979000000 |
| Friday, January 1, 2021 | 3383000000 | 1199000000 |
| Saturday, January 1, 2022 | 3863000000 | 1400000000 |
| Sunday, January 1, 2023 | 3601000000 | 1527000000 |
| Monday, January 1, 2024 | 4507000000 | 1645000000 |
Unleashing the power of data
In the ever-evolving landscape of industrial giants, Deere & Company and United Rentals, Inc. have showcased distinct trajectories in their Selling, General, and Administrative (SG&A) expenses over the past decade. From 2014 to 2024, Deere & Company has seen a steady increase in SG&A costs, peaking at an impressive 4.5 billion USD in 2024, marking a 37% rise from 2014. This reflects their strategic investments in innovation and market expansion.
Conversely, United Rentals, Inc. has demonstrated a more dynamic growth pattern, with SG&A expenses more than doubling from 758 million USD in 2014 to 1.6 billion USD in 2024. This 117% surge underscores their aggressive market penetration and operational scaling. As these industry leaders navigate the complexities of global markets, their SG&A trends offer a window into their strategic priorities and financial health.
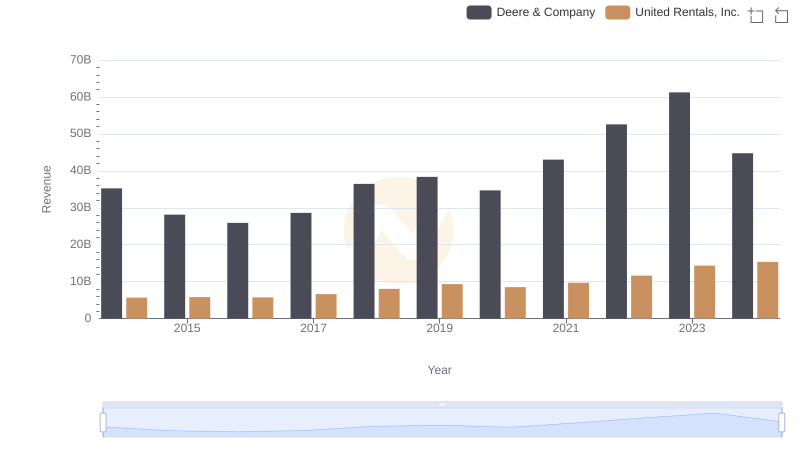
Deere & Company and United Rentals, Inc.: A Comprehensive Revenue Analysis
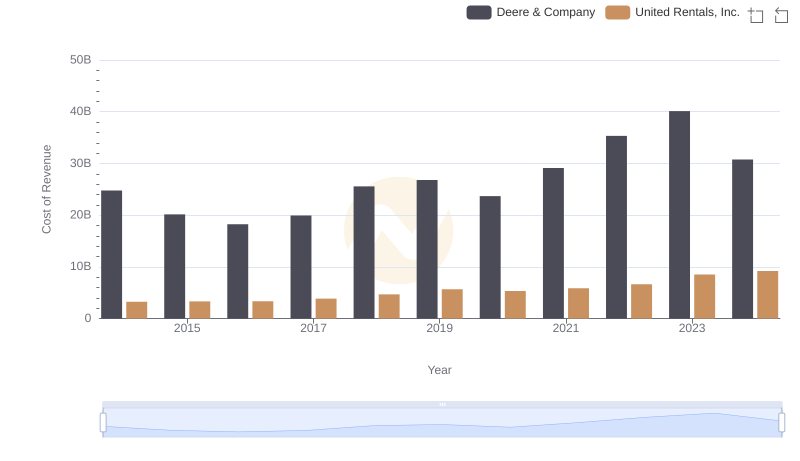
Comparing Cost of Revenue Efficiency: Deere & Company vs United Rentals, Inc.
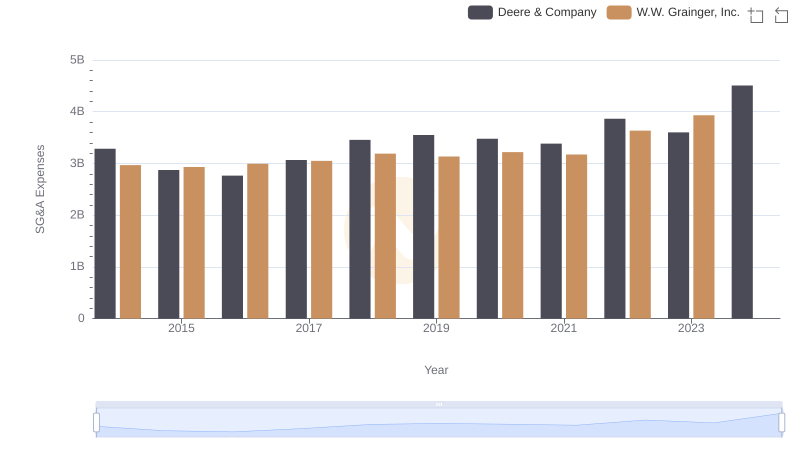
Deere & Company or W.W. Grainger, Inc.: Who Manages SG&A Costs Better?
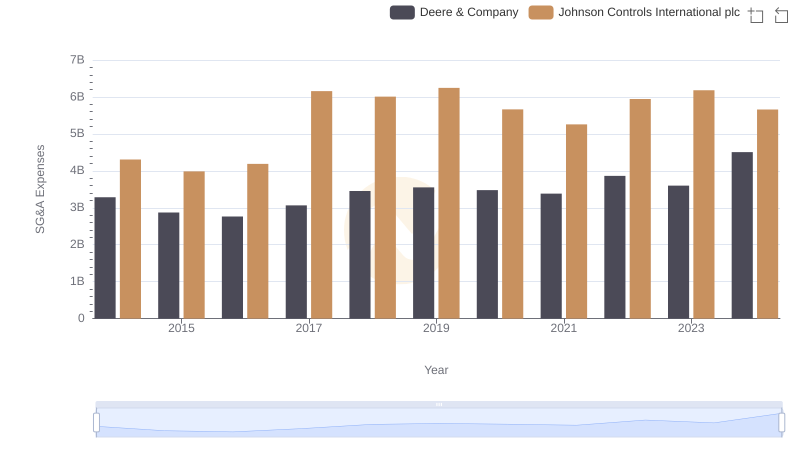
Deere & Company vs Johnson Controls International plc: SG&A Expense Trends
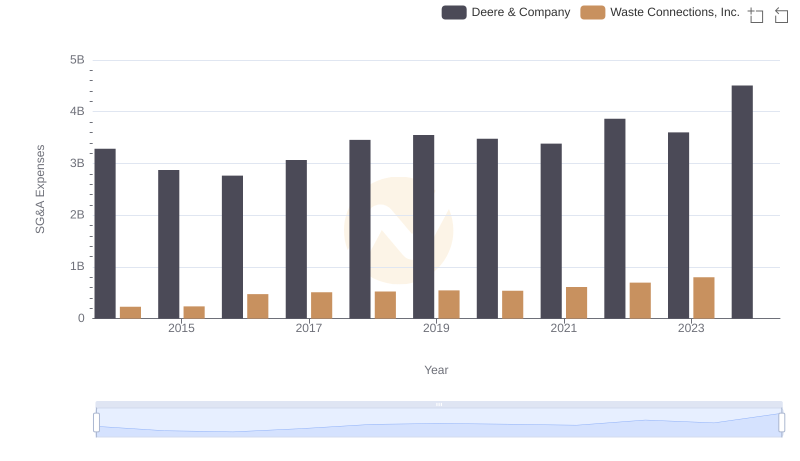
SG&A Efficiency Analysis: Comparing Deere & Company and Waste Connections, Inc.
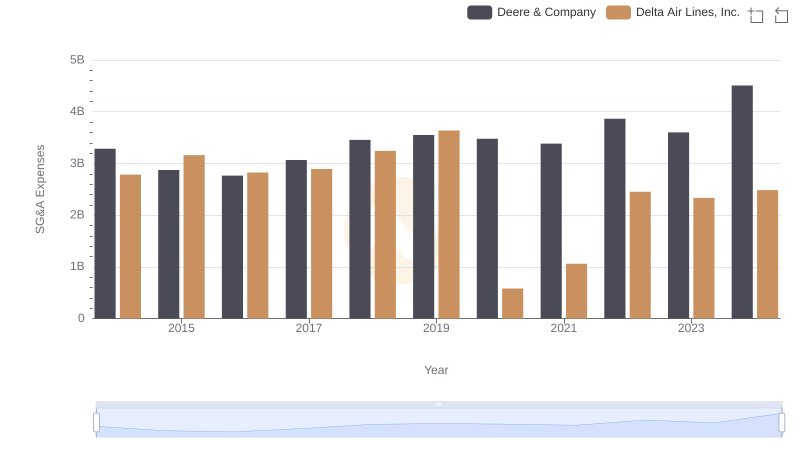
Who Optimizes SG&A Costs Better? Deere & Company or Delta Air Lines, Inc.

Deere & Company or PACCAR Inc: Who Manages SG&A Costs Better?