| __timestamp | Accenture plc | Marvell Technology, Inc. |
|---|---|---|
| Wednesday, January 1, 2014 | 5401969000 | 259169000 |
| Thursday, January 1, 2015 | 5373370000 | 273982000 |
| Friday, January 1, 2016 | 5466982000 | 280970000 |
| Sunday, January 1, 2017 | 6397883000 | 299727000 |
| Monday, January 1, 2018 | 6601872000 | 238166000 |
| Tuesday, January 1, 2019 | 7009614000 | 424360000 |
| Wednesday, January 1, 2020 | 7462514000 | 464580000 |
| Friday, January 1, 2021 | 8742599000 | 467240000 |
| Saturday, January 1, 2022 | 10334358000 | 955245000 |
| Sunday, January 1, 2023 | 10858572000 | 843600000 |
| Monday, January 1, 2024 | 11128030000 | 834000000 |
Infusing magic into the data realm
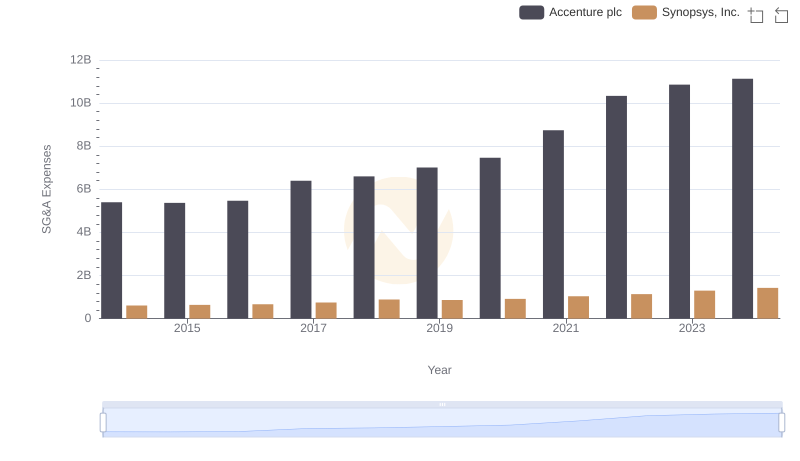
In the ever-evolving landscape of technology and consulting, operational efficiency is paramount. Over the past decade, Accenture plc and Marvell Technology, Inc. have showcased contrasting trajectories in their Selling, General, and Administrative (SG&A) expenses. Accenture, a global consulting giant, has seen its SG&A expenses grow by approximately 106% from 2014 to 2024, reflecting its expansive global operations and strategic investments. In contrast, Marvell Technology, a leader in semiconductor solutions, has maintained a more modest increase of around 222% in the same period, highlighting its focus on streamlined operations and innovation.
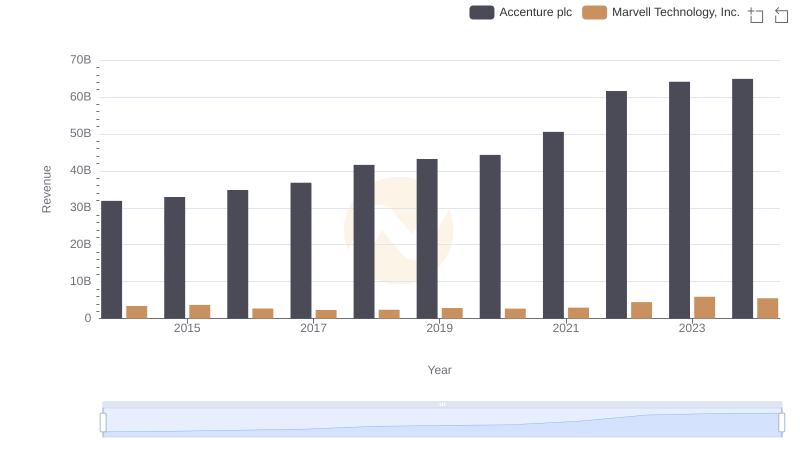
Revenue Showdown: Accenture plc vs Marvell Technology, Inc.
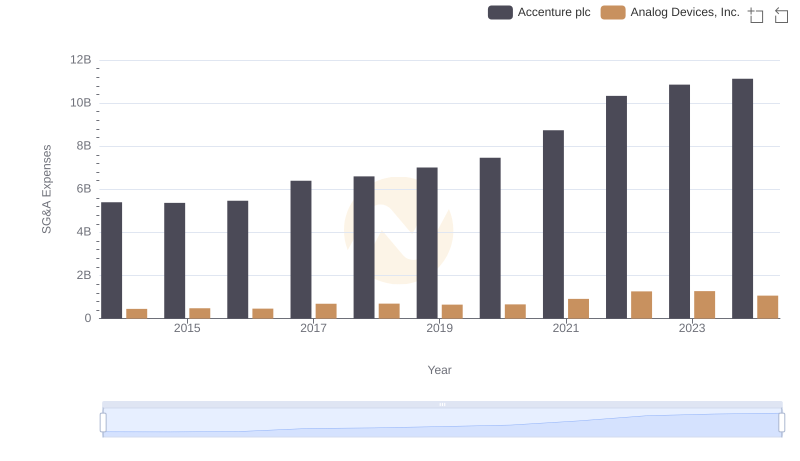
Cost Management Insights: SG&A Expenses for Accenture plc and Analog Devices, Inc.
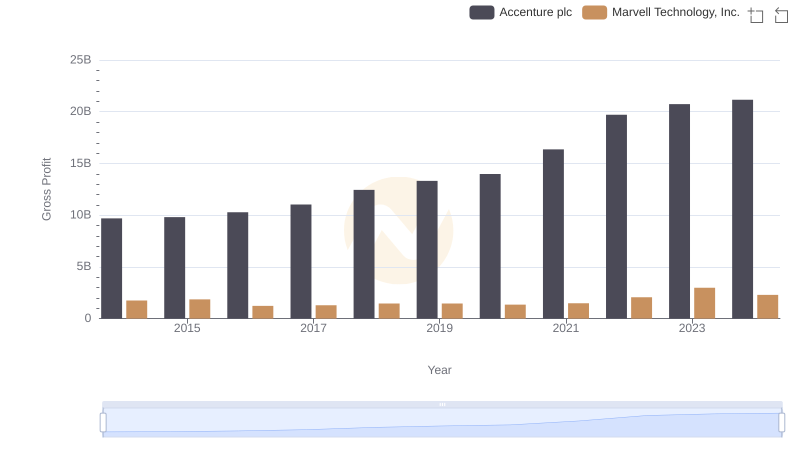
Who Generates Higher Gross Profit? Accenture plc or Marvell Technology, Inc.
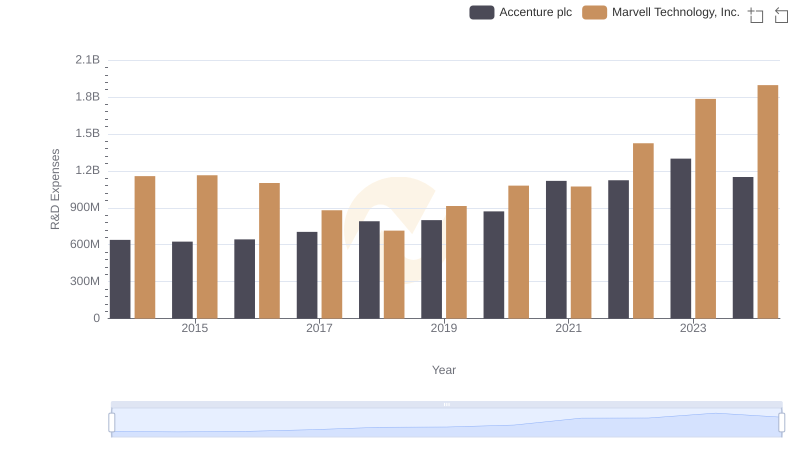
R&D Spending Showdown: Accenture plc vs Marvell Technology, Inc.

Accenture plc and KLA Corporation: SG&A Spending Patterns Compared
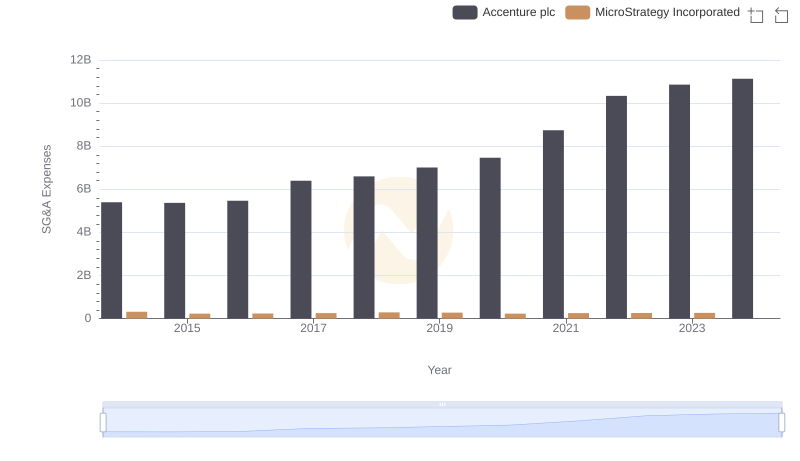
Cost Management Insights: SG&A Expenses for Accenture plc and MicroStrategy Incorporated
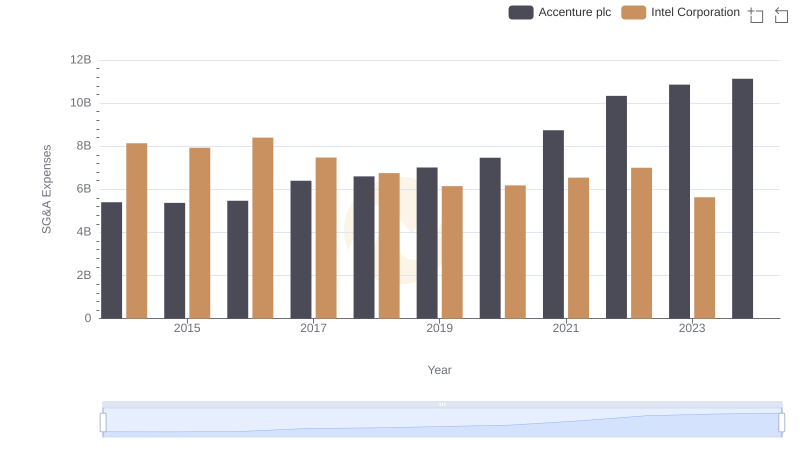
Breaking Down SG&A Expenses: Accenture plc vs Intel Corporation
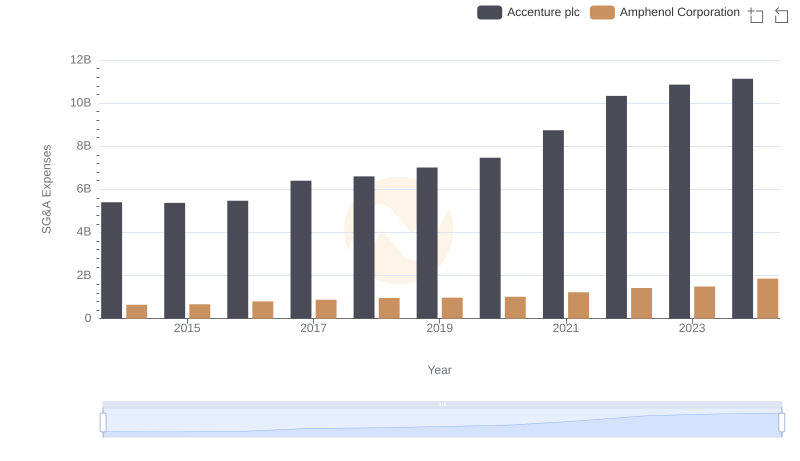
Who Optimizes SG&A Costs Better? Accenture plc or Amphenol Corporation
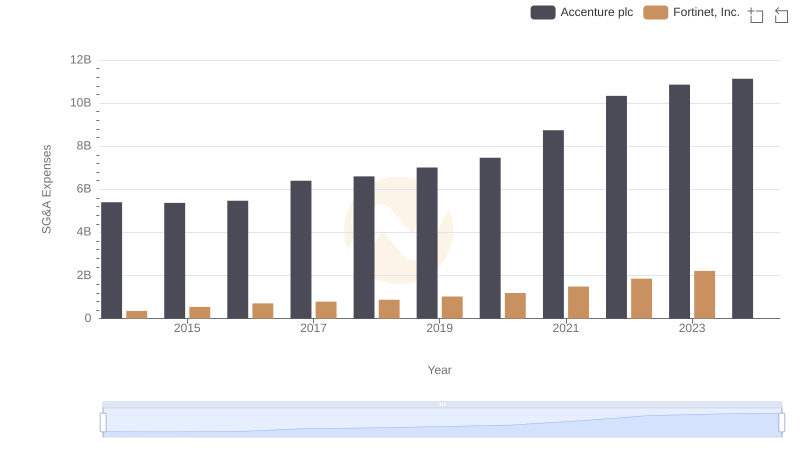
Accenture plc vs Fortinet, Inc.: SG&A Expense Trends
Comparing SG&A Expenses: Accenture plc vs Synopsys, Inc. Trends and Insights