| __timestamp | Atlassian Corporation | Micron Technology, Inc. |
|---|---|---|
| Wednesday, January 1, 2014 | 215109000 | 16358000000 |
| Thursday, January 1, 2015 | 319521000 | 16192000000 |
| Friday, January 1, 2016 | 457058000 | 12399000000 |
| Sunday, January 1, 2017 | 619936000 | 20322000000 |
| Monday, January 1, 2018 | 873950000 | 30391000000 |
| Tuesday, January 1, 2019 | 1210127000 | 23406000000 |
| Wednesday, January 1, 2020 | 1614173000 | 21435000000 |
| Friday, January 1, 2021 | 2089132000 | 27705000000 |
| Saturday, January 1, 2022 | 2802882000 | 30758000000 |
| Sunday, January 1, 2023 | 3534647000 | 15540000000 |
| Monday, January 1, 2024 | 4358603000 | 25111000000 |
Unleashing insights
In the ever-evolving landscape of technology, revenue growth is a key indicator of a company's success. Over the past decade, Micron Technology, Inc. and Atlassian Corporation have showcased contrasting trajectories in their financial journeys.
From 2014 to 2024, Micron Technology's revenue has seen fluctuations, peaking in 2018 with a staggering 30% increase from the previous year, before experiencing a dip in 2023. Meanwhile, Atlassian Corporation has demonstrated a consistent upward trend, with a remarkable 20-fold increase in revenue from 2014 to 2024. This growth highlights Atlassian's strategic expansion and market penetration.
While Micron's revenue reflects the cyclical nature of the semiconductor industry, Atlassian's steady rise underscores the growing demand for software solutions. As we look to the future, these trends offer valuable insights into the dynamic forces shaping the tech industry.
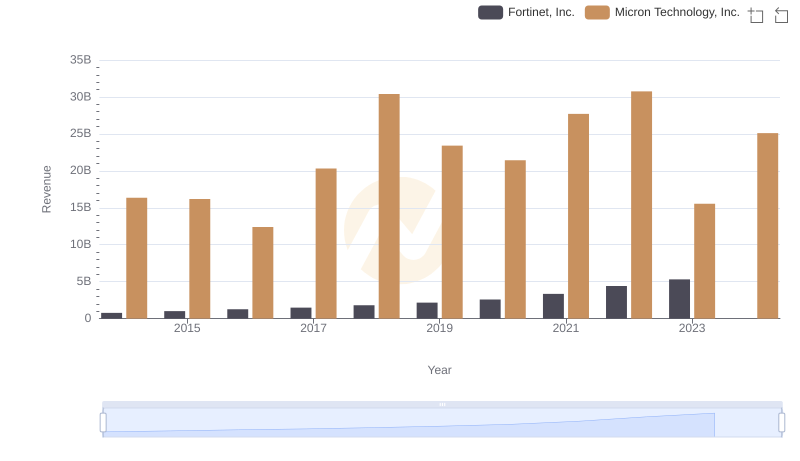
Micron Technology, Inc. or Fortinet, Inc.: Who Leads in Yearly Revenue?
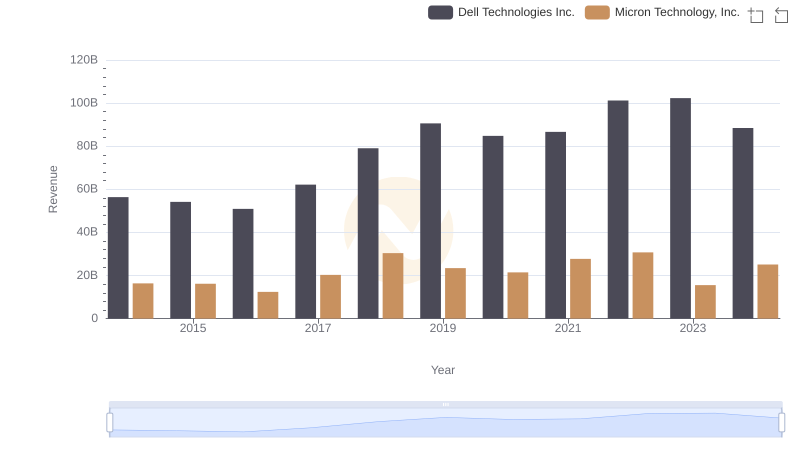
Revenue Showdown: Micron Technology, Inc. vs Dell Technologies Inc.
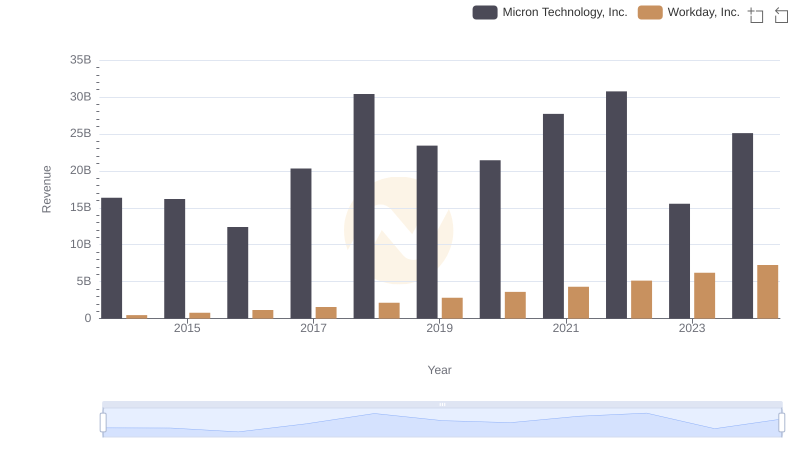
Who Generates More Revenue? Micron Technology, Inc. or Workday, Inc.
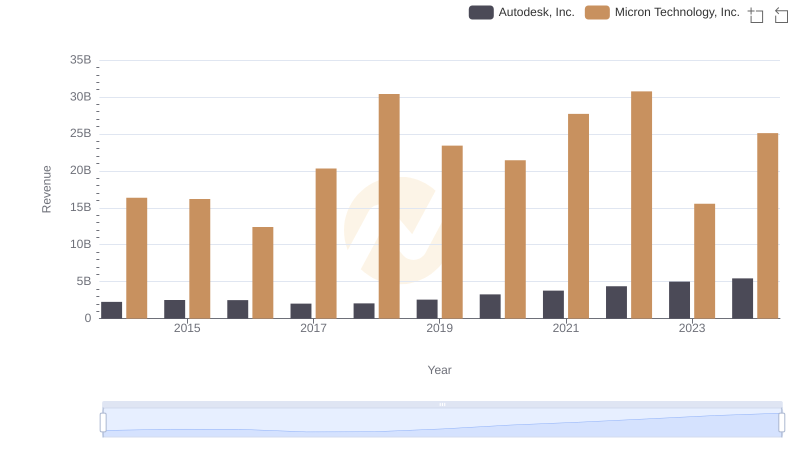
Annual Revenue Comparison: Micron Technology, Inc. vs Autodesk, Inc.
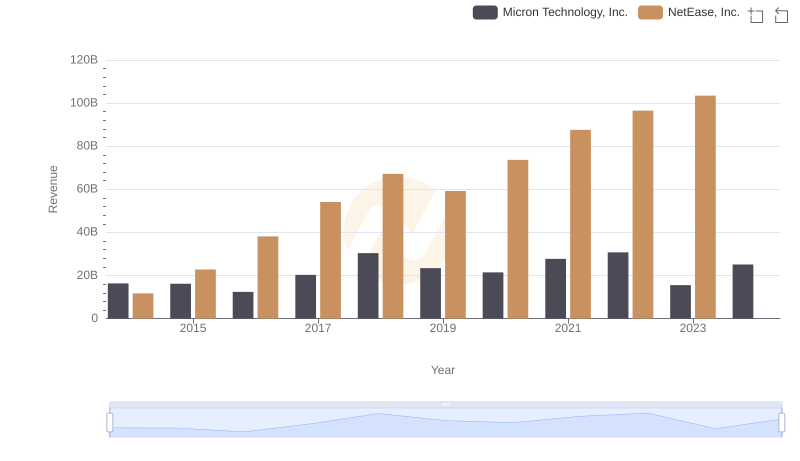
Revenue Showdown: Micron Technology, Inc. vs NetEase, Inc.
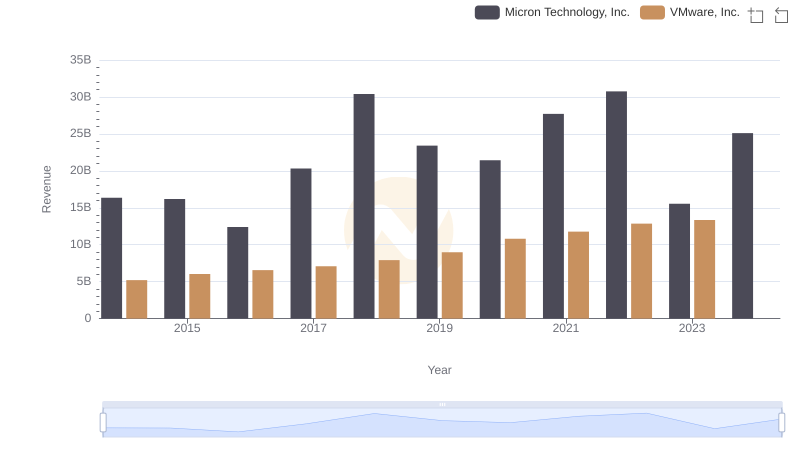
Revenue Insights: Micron Technology, Inc. and VMware, Inc. Performance Compared
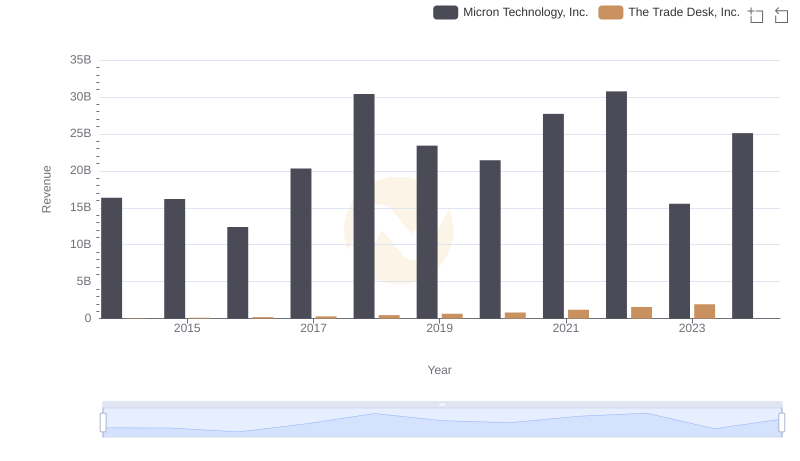
Comparing Revenue Performance: Micron Technology, Inc. or The Trade Desk, Inc.?
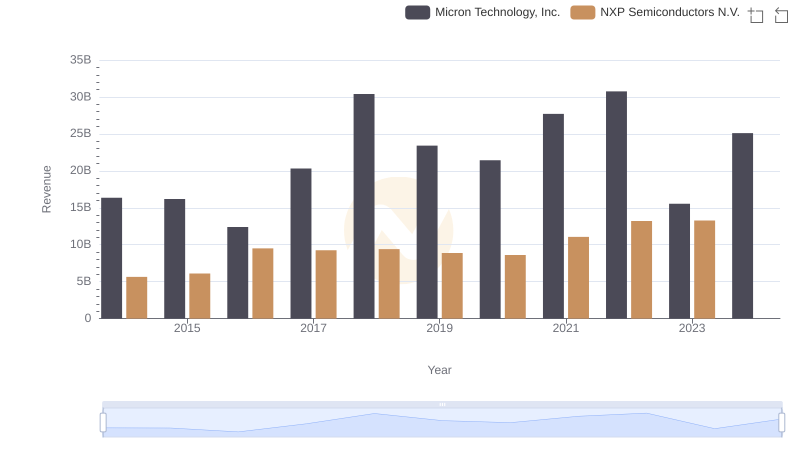
Revenue Insights: Micron Technology, Inc. and NXP Semiconductors N.V. Performance Compared
Comparing Revenue Performance: Micron Technology, Inc. or Block, Inc.?
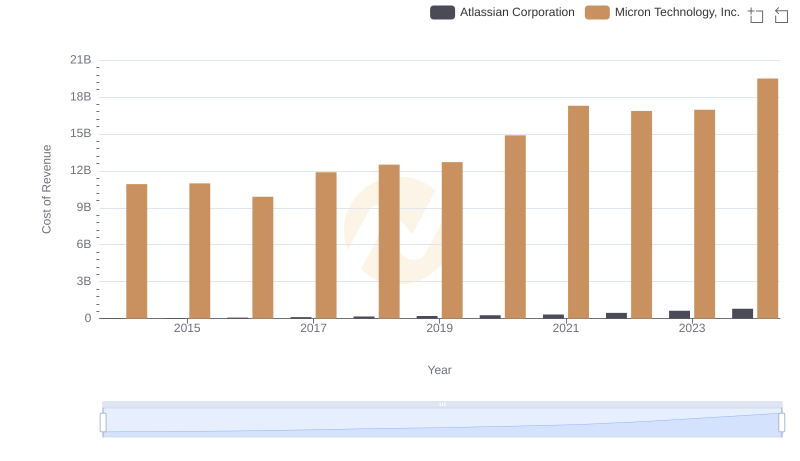
Analyzing Cost of Revenue: Micron Technology, Inc. and Atlassian Corporation
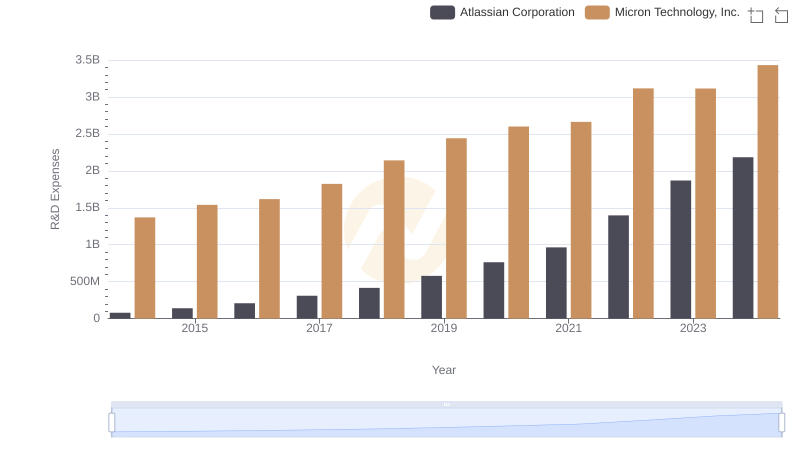
Micron Technology, Inc. or Atlassian Corporation: Who Invests More in Innovation?
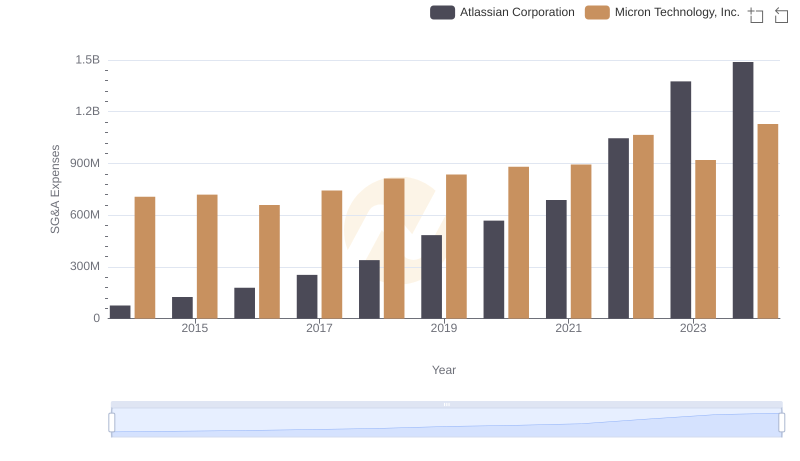
Operational Costs Compared: SG&A Analysis of Micron Technology, Inc. and Atlassian Corporation