| __timestamp | HP Inc. | Marvell Technology, Inc. |
|---|---|---|
| Wednesday, January 1, 2014 | 111454000000 | 3404400000 |
| Thursday, January 1, 2015 | 51463000000 | 3706963000 |
| Friday, January 1, 2016 | 48238000000 | 2725828000 |
| Sunday, January 1, 2017 | 52056000000 | 2317674000 |
| Monday, January 1, 2018 | 58472000000 | 2409170000 |
| Tuesday, January 1, 2019 | 58756000000 | 2865791000 |
| Wednesday, January 1, 2020 | 56639000000 | 2699161000 |
| Friday, January 1, 2021 | 63487000000 | 2968900000 |
| Saturday, January 1, 2022 | 62983000000 | 4462383000 |
| Sunday, January 1, 2023 | 53718000000 | 5919600000 |
| Monday, January 1, 2024 | 53559000000 | 5507700000 |
Unlocking the unknown
In the ever-evolving tech industry, revenue growth is a key indicator of a company's market position and potential. Over the past decade, HP Inc. has consistently outpaced Marvell Technology in terms of annual revenue. In 2014, HP Inc.'s revenue was approximately 32 times that of Marvell Technology. However, the gap has been narrowing, with Marvell's revenue growing by over 73% from 2014 to 2023, while HP Inc. saw a decline of about 52% in the same period.
By 2023, Marvell Technology's revenue reached nearly $5.92 billion, marking a significant increase from its 2014 figures. Meanwhile, HP Inc. experienced fluctuations, peaking in 2014 and 2021, but showing a downward trend in recent years. This shift highlights Marvell's growing influence in the tech sector, as it continues to innovate and expand its market reach.
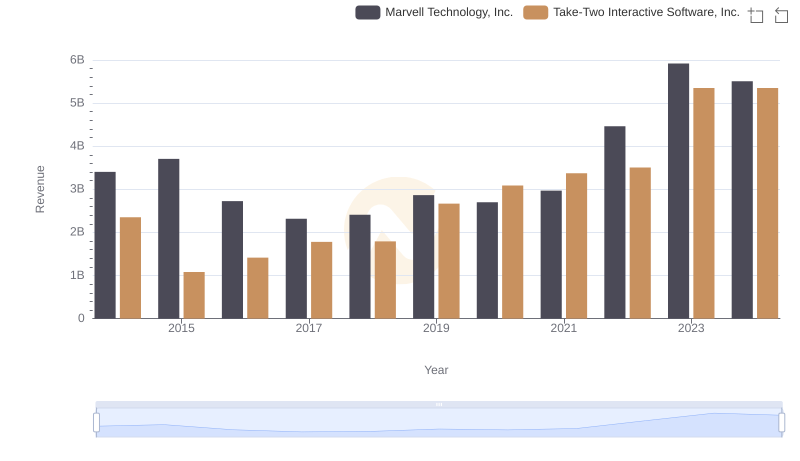
Revenue Insights: Marvell Technology, Inc. and Take-Two Interactive Software, Inc. Performance Compared
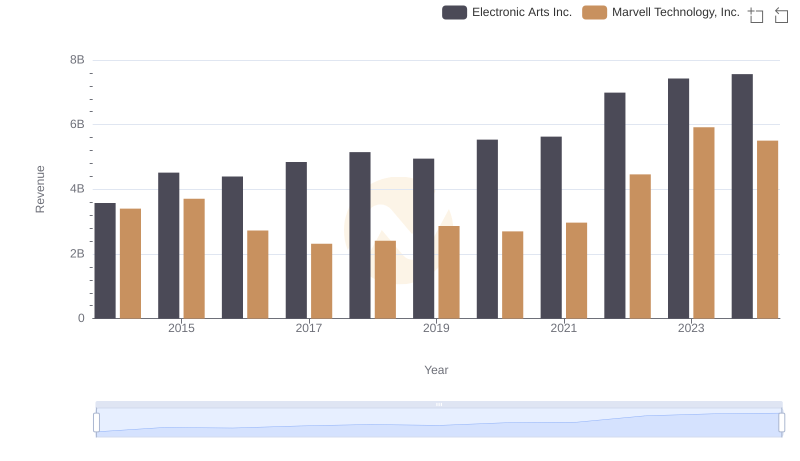
Breaking Down Revenue Trends: Marvell Technology, Inc. vs Electronic Arts Inc.
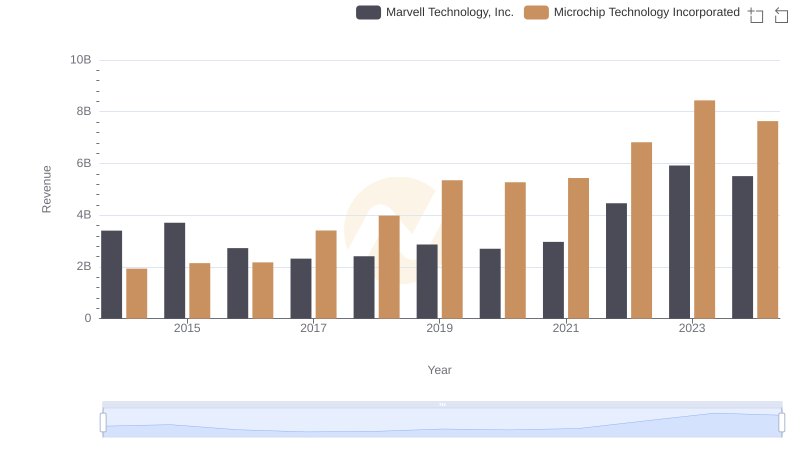
Annual Revenue Comparison: Marvell Technology, Inc. vs Microchip Technology Incorporated
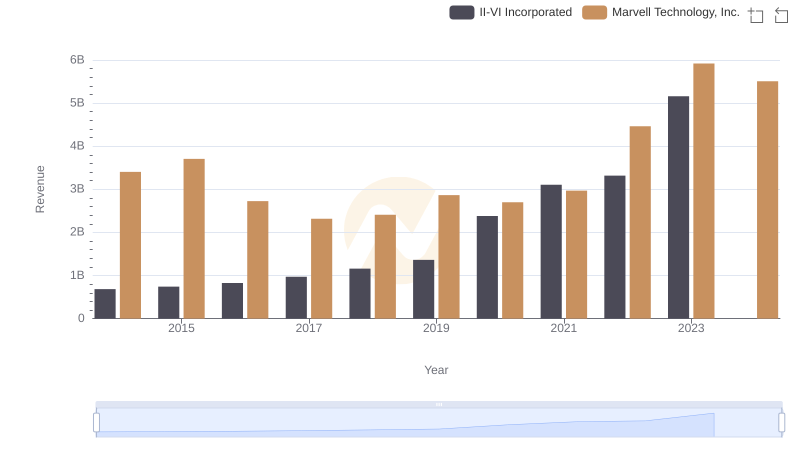
Marvell Technology, Inc. and II-VI Incorporated: A Comprehensive Revenue Analysis
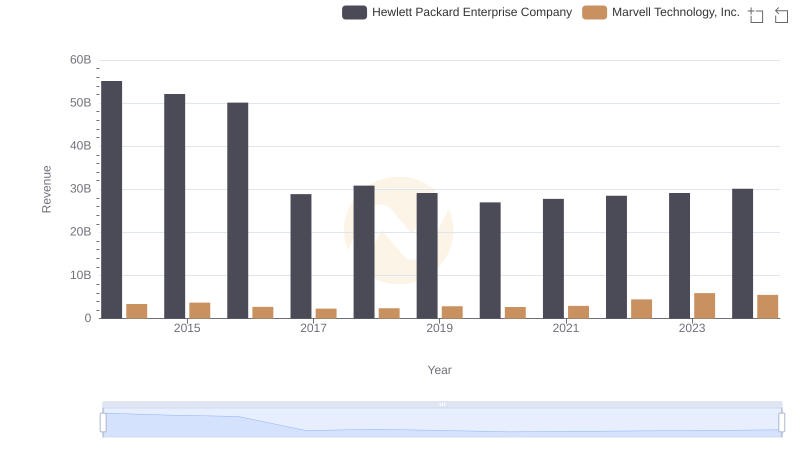
Marvell Technology, Inc. or Hewlett Packard Enterprise Company: Who Leads in Yearly Revenue?
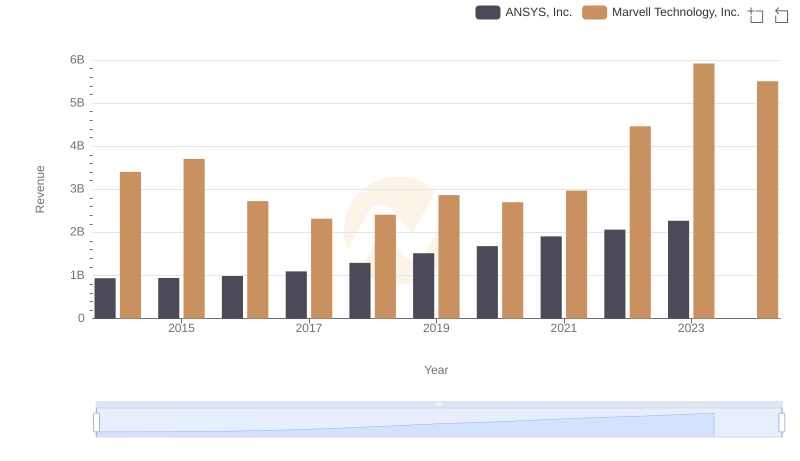
Marvell Technology, Inc. or ANSYS, Inc.: Who Leads in Yearly Revenue?
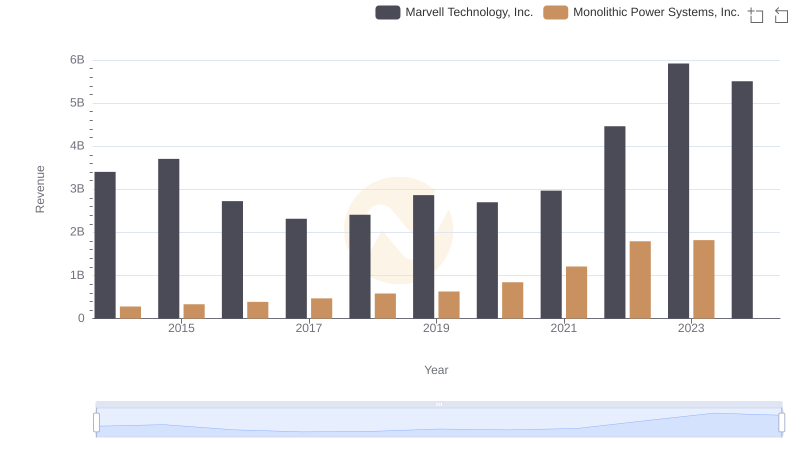
Marvell Technology, Inc. or Monolithic Power Systems, Inc.: Who Leads in Yearly Revenue?
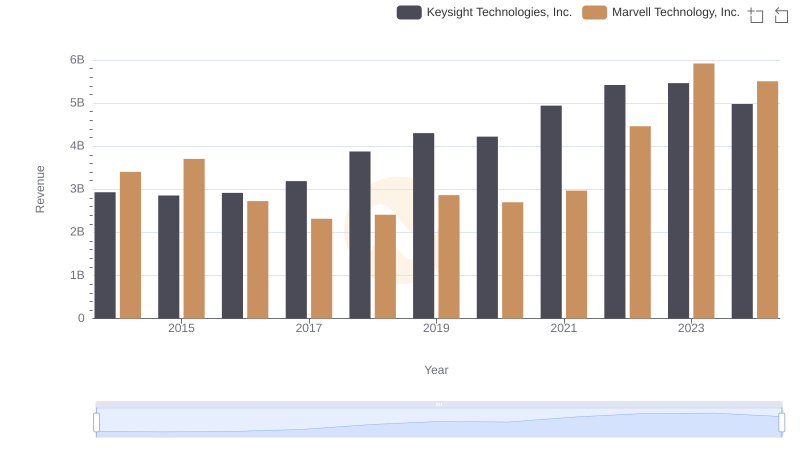
Revenue Showdown: Marvell Technology, Inc. vs Keysight Technologies, Inc.
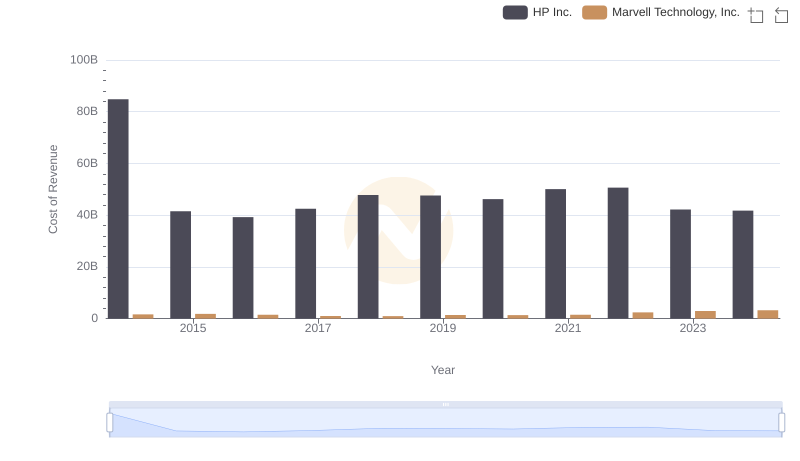
Cost of Revenue: Key Insights for Marvell Technology, Inc. and HP Inc.
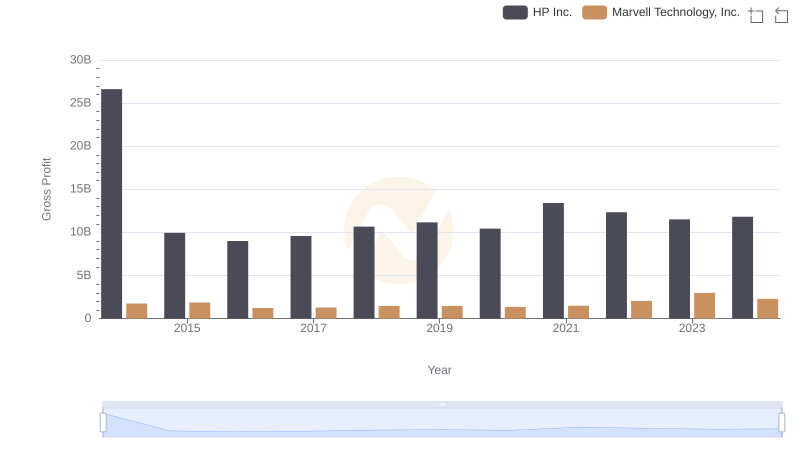
Marvell Technology, Inc. and HP Inc.: A Detailed Gross Profit Analysis
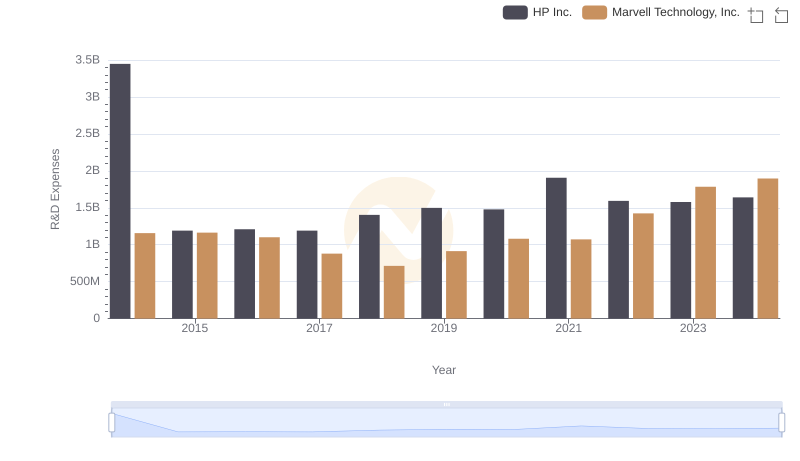
Research and Development: Comparing Key Metrics for Marvell Technology, Inc. and HP Inc.
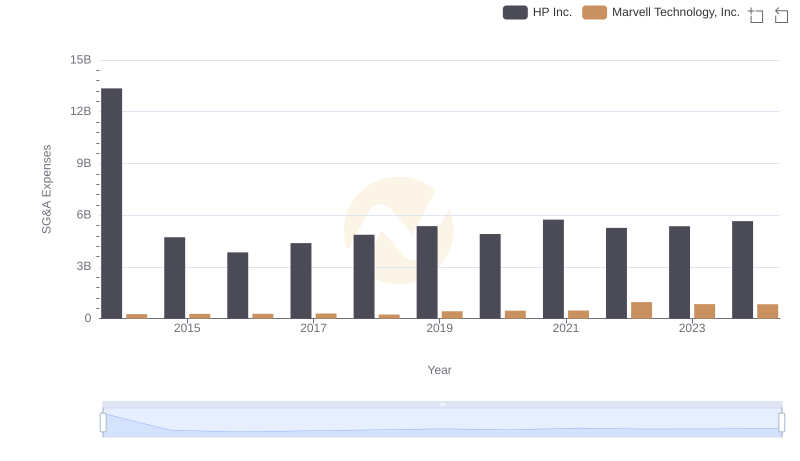
Operational Costs Compared: SG&A Analysis of Marvell Technology, Inc. and HP Inc.