| __timestamp | Marvell Technology, Inc. | Microchip Technology Incorporated |
|---|---|---|
| Wednesday, January 1, 2014 | 259169000 | 267278000 |
| Thursday, January 1, 2015 | 273982000 | 274815000 |
| Friday, January 1, 2016 | 280970000 | 301670000 |
| Sunday, January 1, 2017 | 299727000 | 499811000 |
| Monday, January 1, 2018 | 238166000 | 452100000 |
| Tuesday, January 1, 2019 | 424360000 | 682900000 |
| Wednesday, January 1, 2020 | 464580000 | 676600000 |
| Friday, January 1, 2021 | 467240000 | 610300000 |
| Saturday, January 1, 2022 | 955245000 | 718900000 |
| Sunday, January 1, 2023 | 843600000 | 797700000 |
| Monday, January 1, 2024 | 834000000 | 734200000 |
Cracking the code
In the ever-evolving tech industry, understanding spending patterns is crucial. Over the past decade, Marvell Technology, Inc. and Microchip Technology Incorporated have shown distinct trends in their Selling, General, and Administrative (SG&A) expenses. From 2014 to 2024, Marvell's SG&A expenses surged by approximately 222%, peaking in 2022. In contrast, Microchip's expenses grew by about 175%, with a notable increase in 2019.
Marvell's spending saw a dramatic rise in 2022, reaching its highest point, while Microchip's expenses remained relatively stable after a significant jump in 2019. This divergence highlights Marvell's aggressive investment strategy compared to Microchip's more consistent approach. As both companies navigate the competitive landscape, their SG&A spending patterns offer a window into their strategic priorities and market positioning.
These insights into SG&A trends provide valuable context for investors and industry analysts seeking to understand the financial strategies of these tech giants.
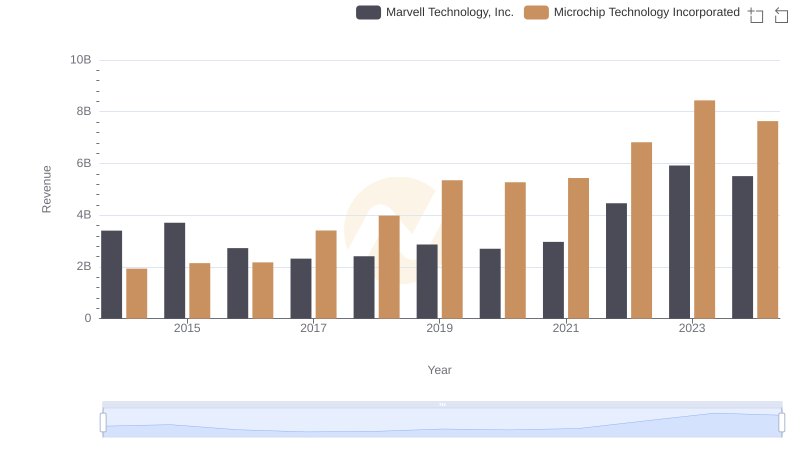
Annual Revenue Comparison: Marvell Technology, Inc. vs Microchip Technology Incorporated
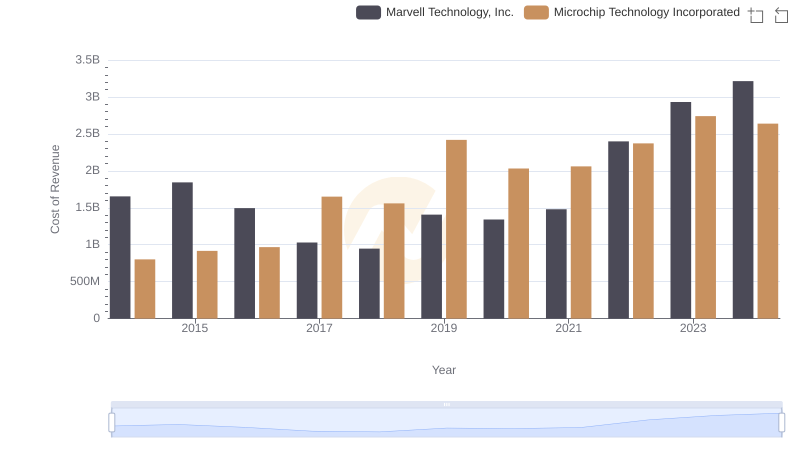
Comparing Cost of Revenue Efficiency: Marvell Technology, Inc. vs Microchip Technology Incorporated
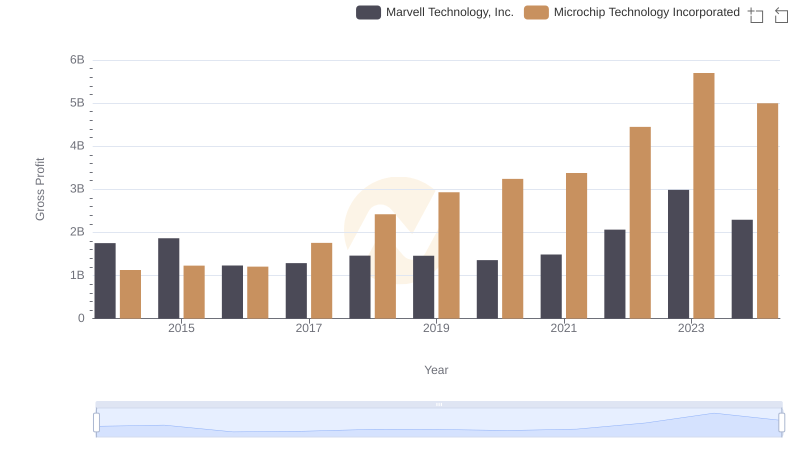
Who Generates Higher Gross Profit? Marvell Technology, Inc. or Microchip Technology Incorporated
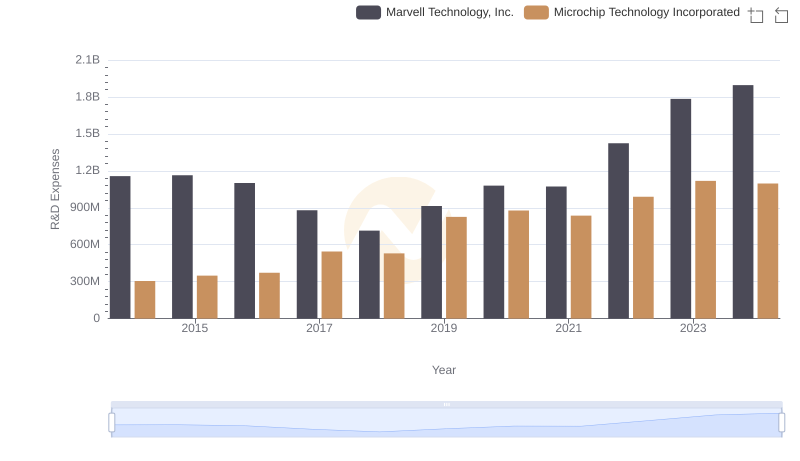
Research and Development Investment: Marvell Technology, Inc. vs Microchip Technology Incorporated
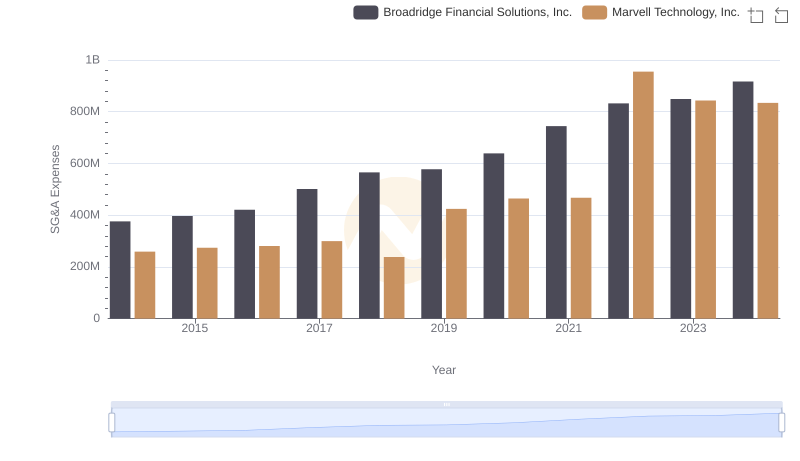
Marvell Technology, Inc. and Broadridge Financial Solutions, Inc.: SG&A Spending Patterns Compared
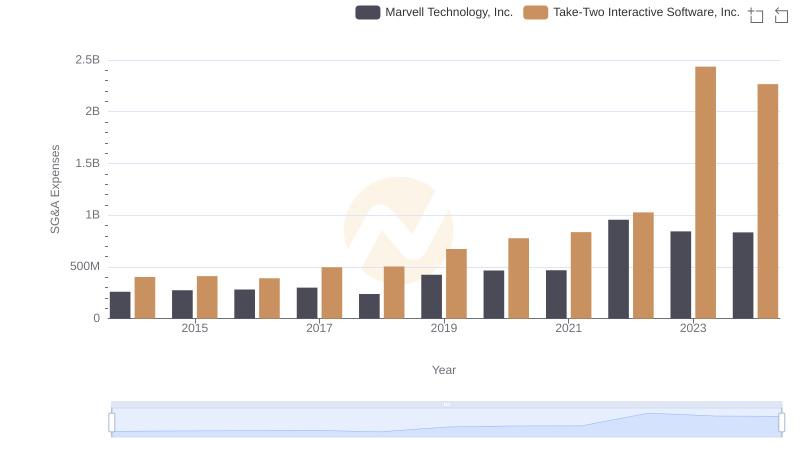
Cost Management Insights: SG&A Expenses for Marvell Technology, Inc. and Take-Two Interactive Software, Inc.
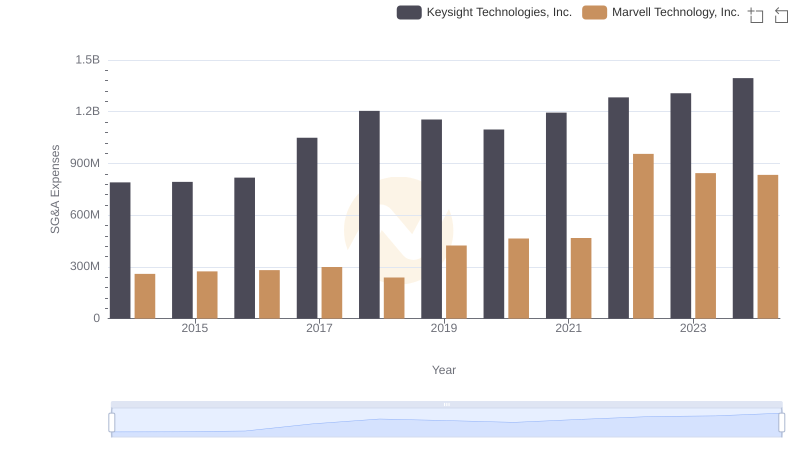
Breaking Down SG&A Expenses: Marvell Technology, Inc. vs Keysight Technologies, Inc.
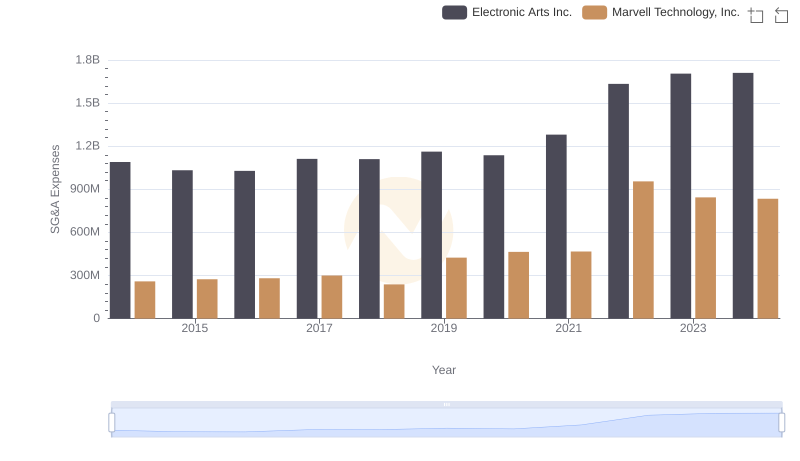
Cost Management Insights: SG&A Expenses for Marvell Technology, Inc. and Electronic Arts Inc.
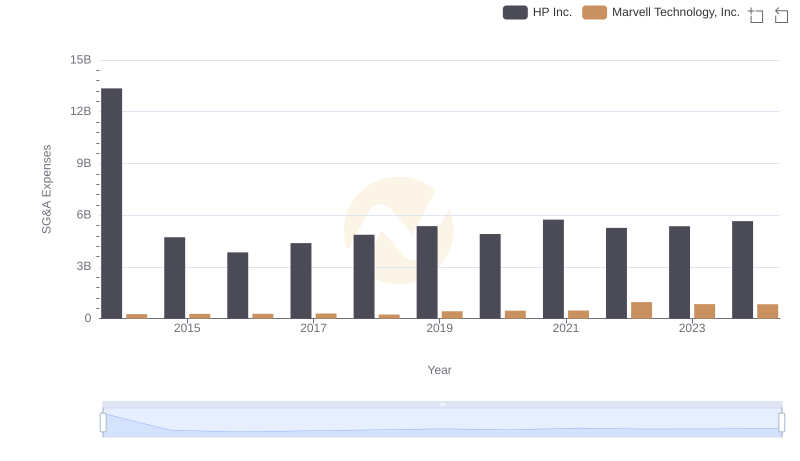
Operational Costs Compared: SG&A Analysis of Marvell Technology, Inc. and HP Inc.
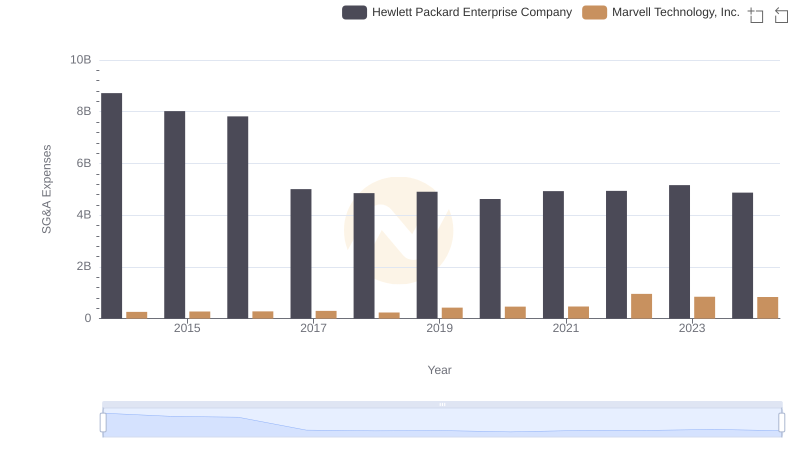
Selling, General, and Administrative Costs: Marvell Technology, Inc. vs Hewlett Packard Enterprise Company
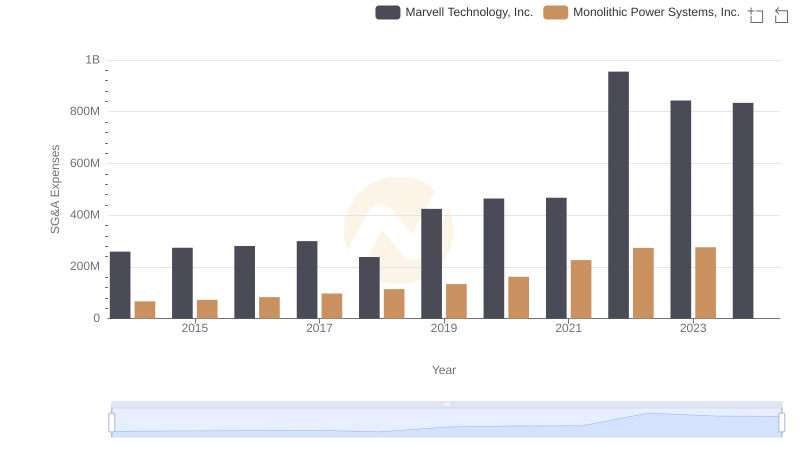
Selling, General, and Administrative Costs: Marvell Technology, Inc. vs Monolithic Power Systems, Inc.
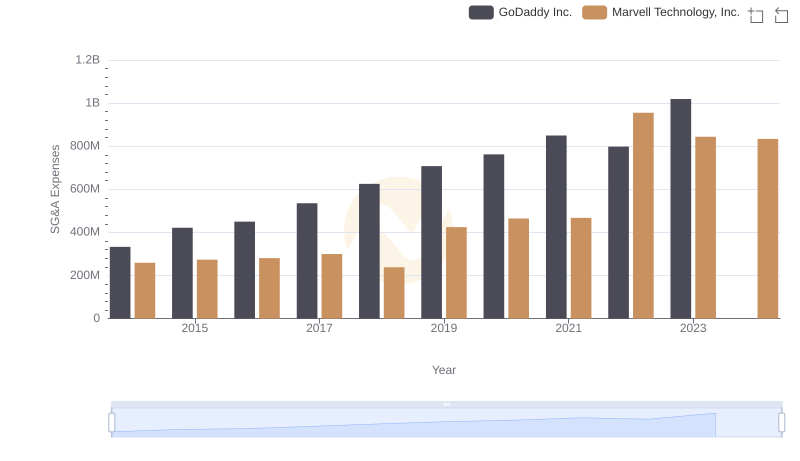
Who Optimizes SG&A Costs Better? Marvell Technology, Inc. or GoDaddy Inc.