| __timestamp | SAP SE | Workday, Inc. |
|---|---|---|
| Wednesday, January 1, 2014 | 12289000000 | 292128000 |
| Thursday, January 1, 2015 | 14167000000 | 523057000 |
| Friday, January 1, 2016 | 15492000000 | 787919000 |
| Sunday, January 1, 2017 | 16409000000 | 1085862000 |
| Monday, January 1, 2018 | 17246000000 | 1513637000 |
| Tuesday, January 1, 2019 | 19202000000 | 1987230000 |
| Wednesday, January 1, 2020 | 19452000000 | 2561948000 |
| Friday, January 1, 2021 | 19894000000 | 3119864000 |
| Saturday, January 1, 2022 | 21936000000 | 3710703000 |
| Sunday, January 1, 2023 | 22603000000 | 4500640000 |
| Monday, January 1, 2024 | 25012000000 | 5488000000 |
Infusing magic into the data realm
In the ever-evolving landscape of enterprise software, SAP SE and Workday, Inc. have emerged as key players. Over the past decade, SAP SE has consistently demonstrated robust growth in gross profit, with a remarkable increase of approximately 84% from 2014 to 2023. This growth underscores SAP's dominance in the market, driven by its comprehensive suite of enterprise solutions.
Conversely, Workday, Inc., a relatively newer entrant, has shown impressive growth, with its gross profit surging by over 1,400% during the same period. This meteoric rise highlights Workday's successful penetration into the cloud-based enterprise software market.
While SAP SE's gross profit reached its peak in 2023, Workday's data for 2024 suggests continued growth, albeit with some missing data points. These trends reflect the dynamic nature of the industry, where innovation and adaptability are key to sustained success.
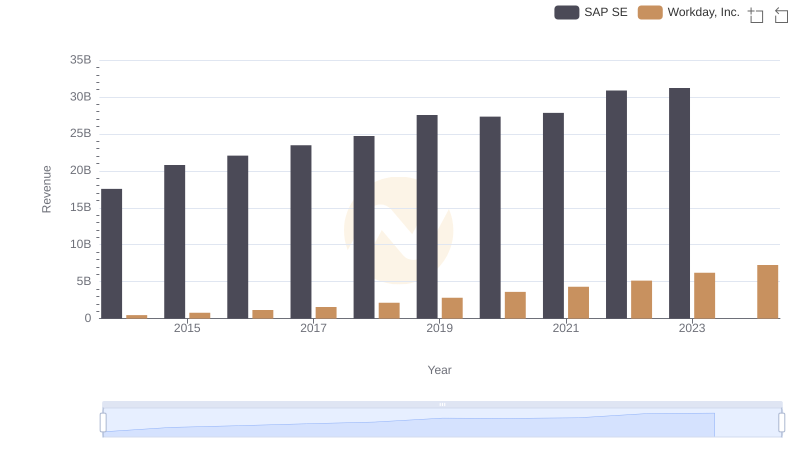
Annual Revenue Comparison: SAP SE vs Workday, Inc.
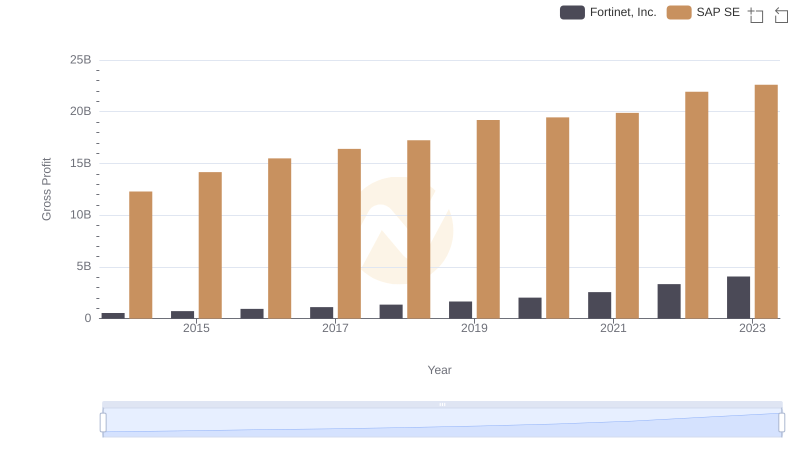
Gross Profit Trends Compared: SAP SE vs Fortinet, Inc.
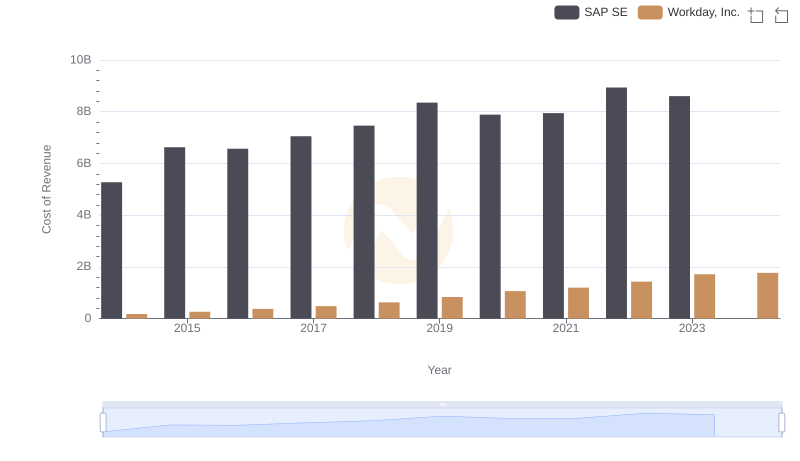
Cost of Revenue: Key Insights for SAP SE and Workday, Inc.
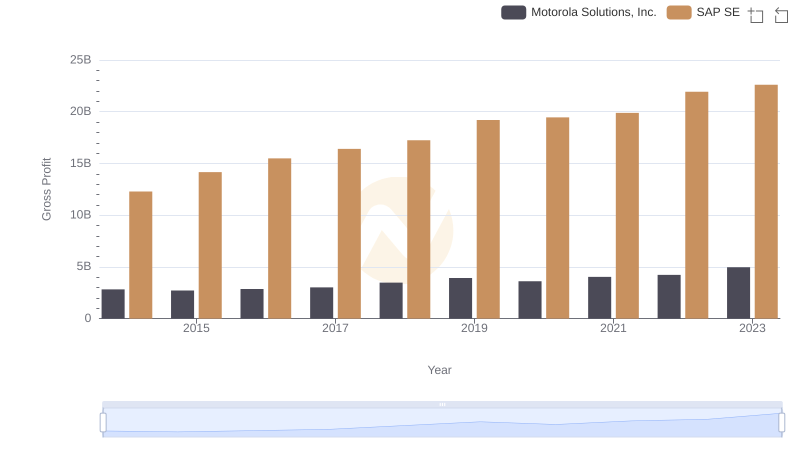
Gross Profit Comparison: SAP SE and Motorola Solutions, Inc. Trends
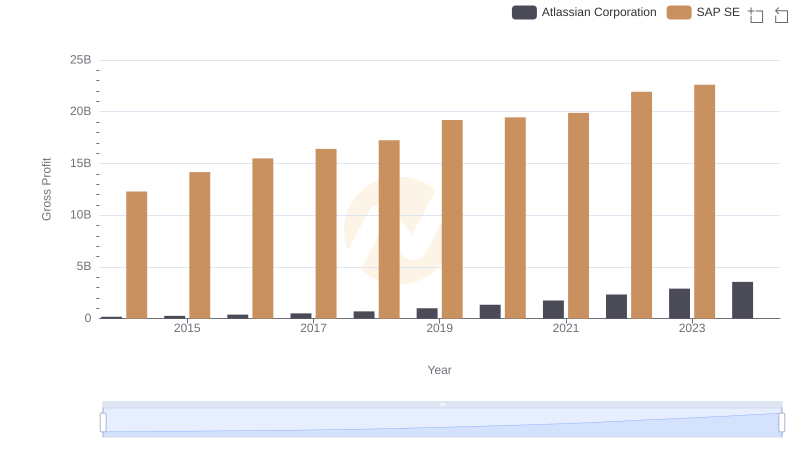
Gross Profit Comparison: SAP SE and Atlassian Corporation Trends
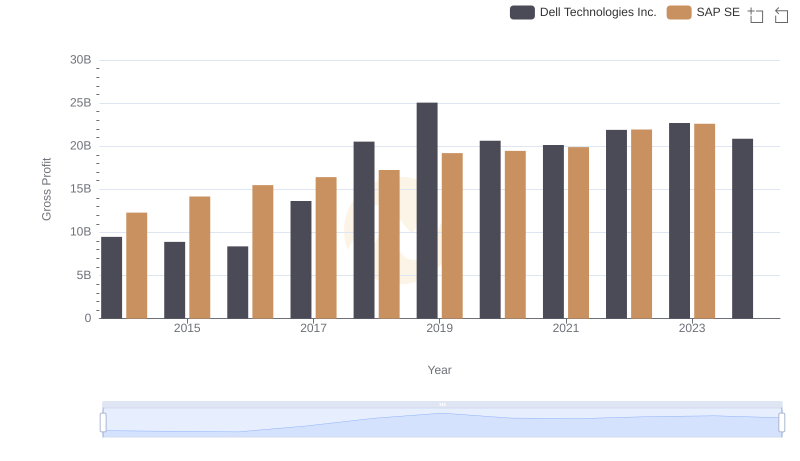
Key Insights on Gross Profit: SAP SE vs Dell Technologies Inc.
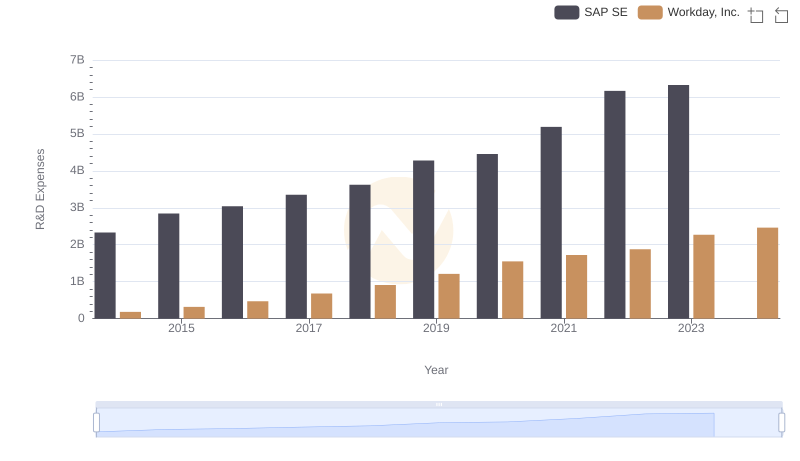
R&D Insights: How SAP SE and Workday, Inc. Allocate Funds
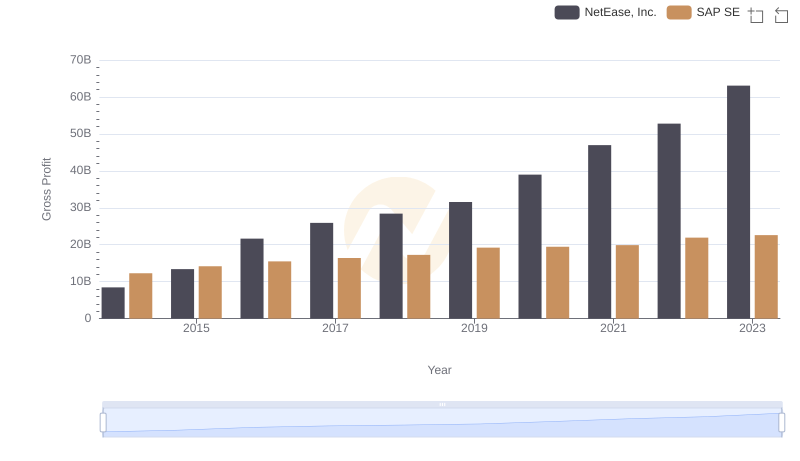
Gross Profit Comparison: SAP SE and NetEase, Inc. Trends
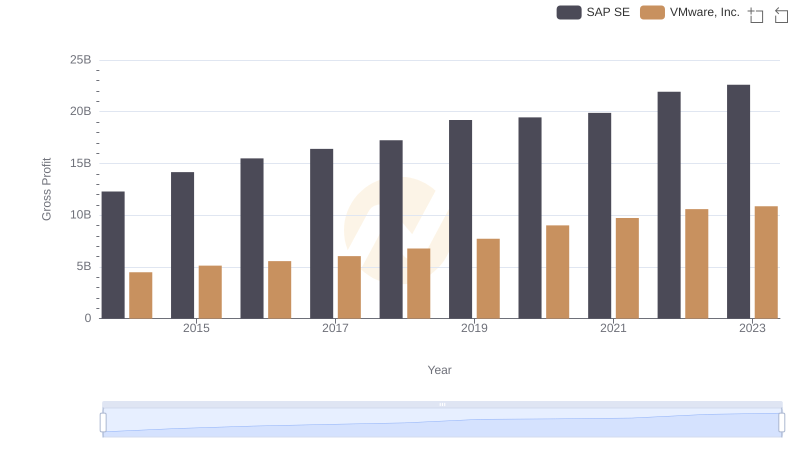
Gross Profit Trends Compared: SAP SE vs VMware, Inc.
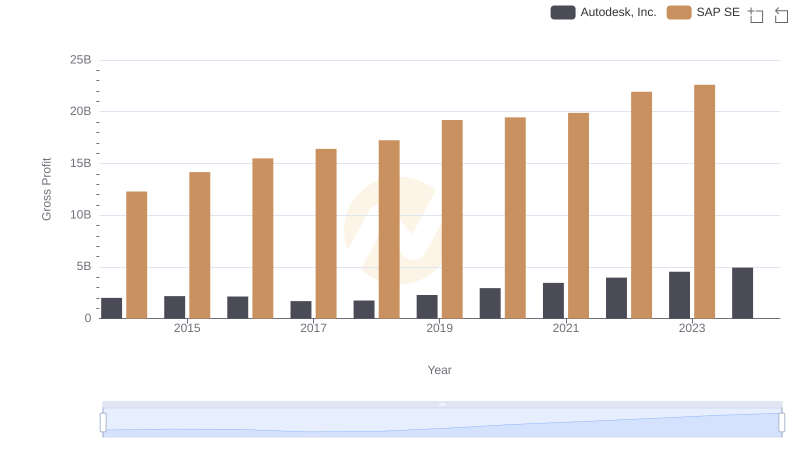
Gross Profit Comparison: SAP SE and Autodesk, Inc. Trends
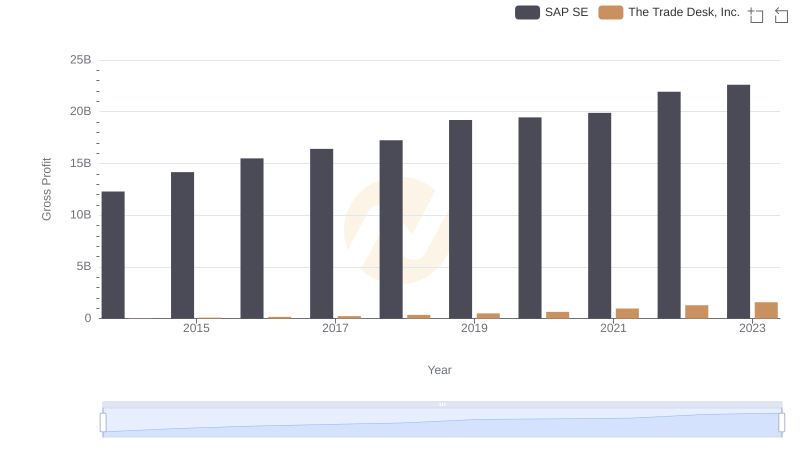
Gross Profit Comparison: SAP SE and The Trade Desk, Inc. Trends
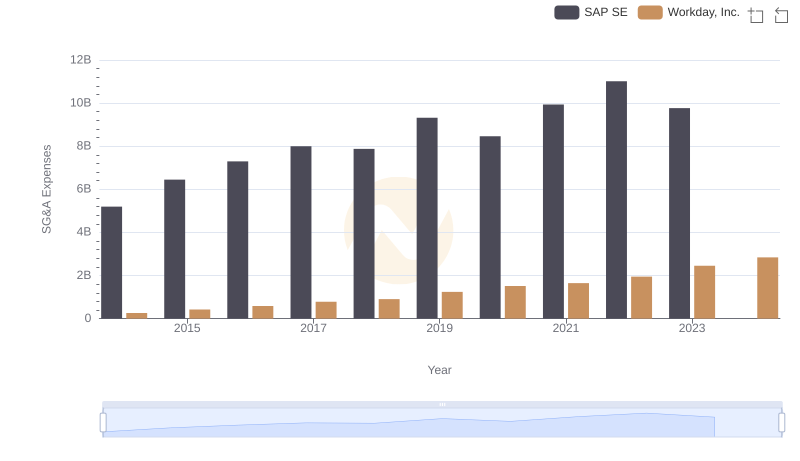
SAP SE vs Workday, Inc.: SG&A Expense Trends