| __timestamp | Oracle Corporation | Palo Alto Networks, Inc. |
|---|---|---|
| Wednesday, January 1, 2014 | 31039000000 | 438551000 |
| Thursday, January 1, 2015 | 30694000000 | 676553000 |
| Friday, January 1, 2016 | 29568000000 | 1008500000 |
| Sunday, January 1, 2017 | 30276000000 | 1285000000 |
| Monday, January 1, 2018 | 31771000000 | 1627800000 |
| Tuesday, January 1, 2019 | 31511000000 | 2091200000 |
| Wednesday, January 1, 2020 | 31130000000 | 2408900000 |
| Friday, January 1, 2021 | 32624000000 | 2981200000 |
| Saturday, January 1, 2022 | 33563000000 | 3782800000 |
| Sunday, January 1, 2023 | 36390000000 | 4983000000 |
| Monday, January 1, 2024 | 37818000000 | 5968300001 |
Cracking the code
In the ever-evolving landscape of technology, Oracle Corporation and Palo Alto Networks, Inc. have demonstrated remarkable growth in gross profit over the past decade. From 2014 to 2024, Oracle's gross profit surged by approximately 22%, reflecting its robust market presence and strategic innovations. Meanwhile, Palo Alto Networks, a leader in cybersecurity, showcased an impressive growth trajectory, with its gross profit increasing by over 1,260% during the same period.
Oracle's consistent performance, with gross profits averaging around $32 billion annually, underscores its dominance in the software industry. In contrast, Palo Alto Networks, starting from a modest base, has rapidly expanded, highlighting the growing importance of cybersecurity solutions in the digital age.
This comparison not only illustrates the diverse strategies of these tech giants but also emphasizes the dynamic nature of the technology sector, where innovation and adaptation are key to sustained success.
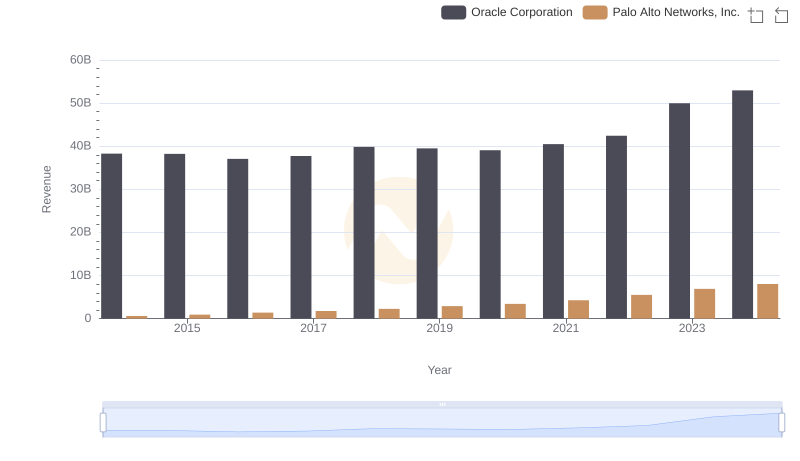
Oracle Corporation vs Palo Alto Networks, Inc.: Examining Key Revenue Metrics
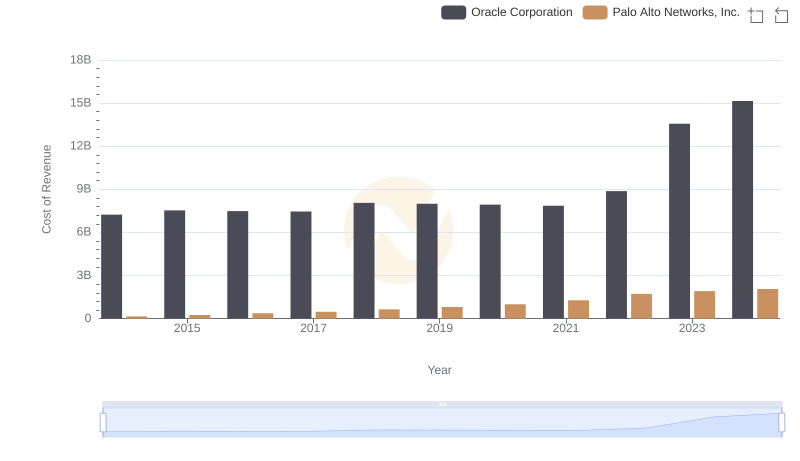
Cost of Revenue Comparison: Oracle Corporation vs Palo Alto Networks, Inc.
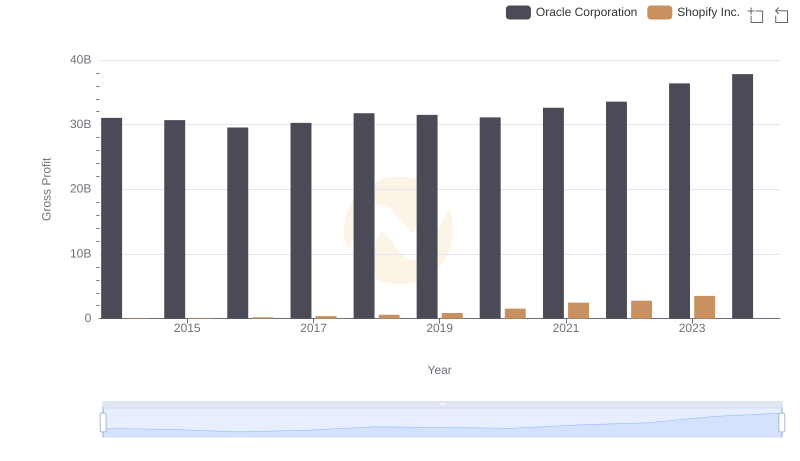
Key Insights on Gross Profit: Oracle Corporation vs Shopify Inc.
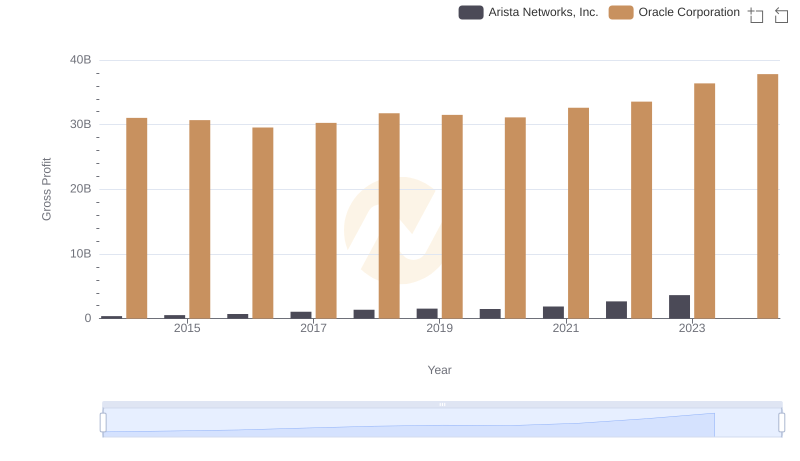
Gross Profit Analysis: Comparing Oracle Corporation and Arista Networks, Inc.
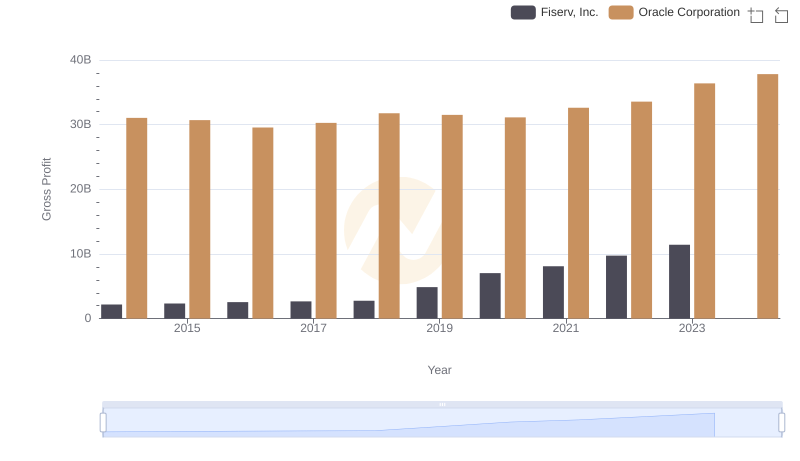
Oracle Corporation vs Fiserv, Inc.: A Gross Profit Performance Breakdown
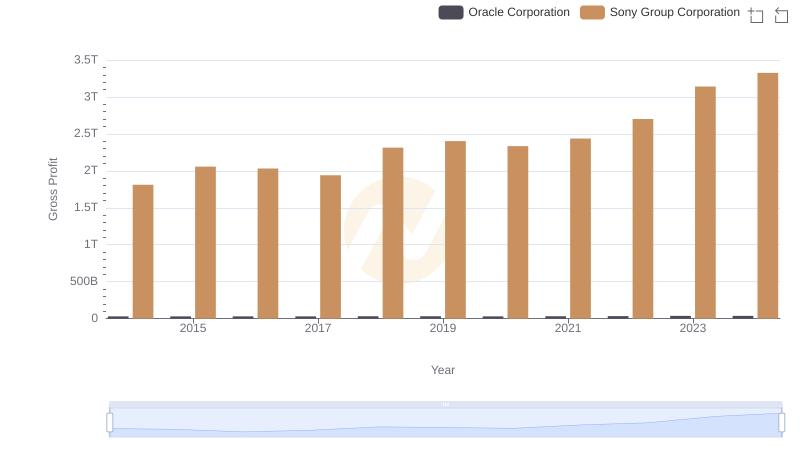
Gross Profit Analysis: Comparing Oracle Corporation and Sony Group Corporation
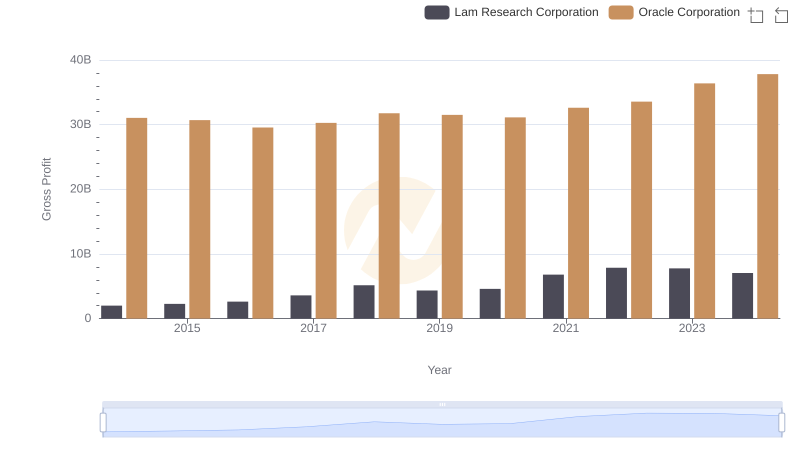
Key Insights on Gross Profit: Oracle Corporation vs Lam Research Corporation

Gross Profit Trends Compared: Oracle Corporation vs Fiserv, Inc.
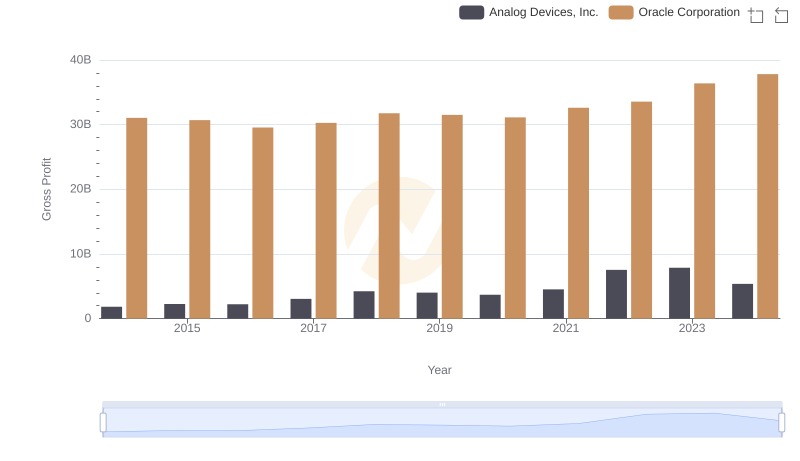
Gross Profit Trends Compared: Oracle Corporation vs Analog Devices, Inc.
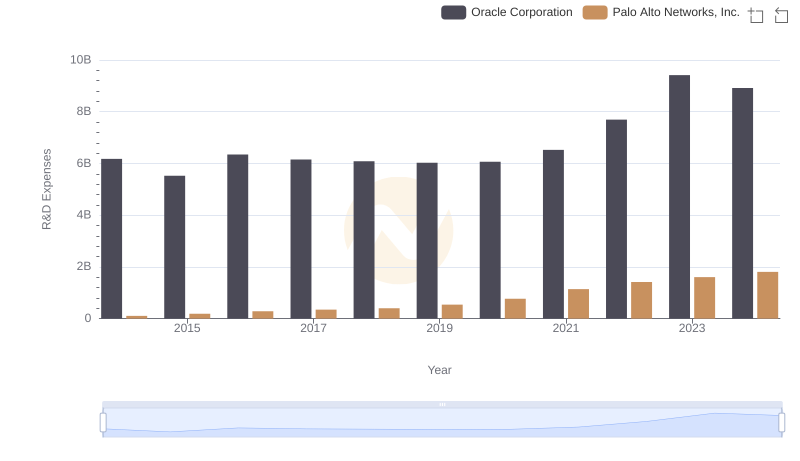
Research and Development Investment: Oracle Corporation vs Palo Alto Networks, Inc.
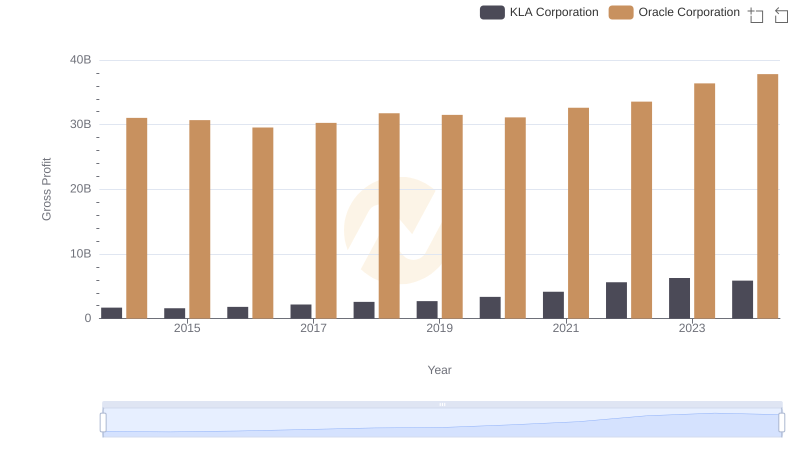
Who Generates Higher Gross Profit? Oracle Corporation or KLA Corporation
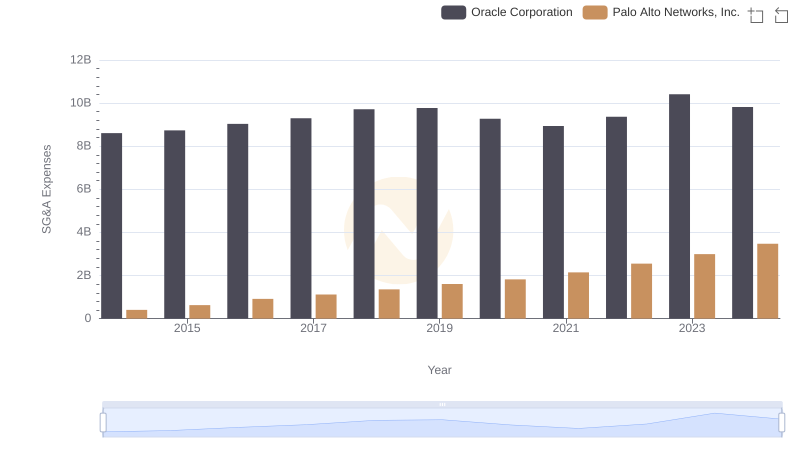
SG&A Efficiency Analysis: Comparing Oracle Corporation and Palo Alto Networks, Inc.