| __timestamp | Deere & Company | Stanley Black & Decker, Inc. |
|---|---|---|
| Wednesday, January 1, 2014 | 10466900000 | 4102700000 |
| Thursday, January 1, 2015 | 8013100000 | 4072000000 |
| Friday, January 1, 2016 | 7649600000 | 4267200000 |
| Sunday, January 1, 2017 | 8683100000 | 4778000000 |
| Monday, January 1, 2018 | 10886100000 | 4901900000 |
| Tuesday, January 1, 2019 | 11587000000 | 4805500000 |
| Wednesday, January 1, 2020 | 11045000000 | 4967900000 |
| Friday, January 1, 2021 | 13917000000 | 5194200000 |
| Saturday, January 1, 2022 | 17239000000 | 4284100000 |
| Sunday, January 1, 2023 | 21117000000 | 4098000000 |
| Monday, January 1, 2024 | 13984000000 | 4514400000 |
Unleashing insights
In the world of industrial manufacturing, Deere & Company and Stanley Black & Decker, Inc. have long been titans. Over the past decade, their financial trajectories have painted a vivid picture of resilience and growth. Deere & Company, renowned for its agricultural machinery, has seen its gross profit soar by approximately 102% from 2014 to 2023, peaking in 2023. This remarkable growth underscores its strategic prowess in navigating market challenges.
Conversely, Stanley Black & Decker, Inc., a leader in tools and storage, has maintained a steady gross profit, with a modest increase of around 27% over the same period. However, 2023 saw a slight dip, highlighting potential market pressures. Notably, data for 2024 is incomplete, leaving room for speculation on future trends. This comparative analysis offers a compelling glimpse into the financial health and strategic direction of these industry leaders.

Deere & Company or Stanley Black & Decker, Inc.: Who Leads in Yearly Revenue?
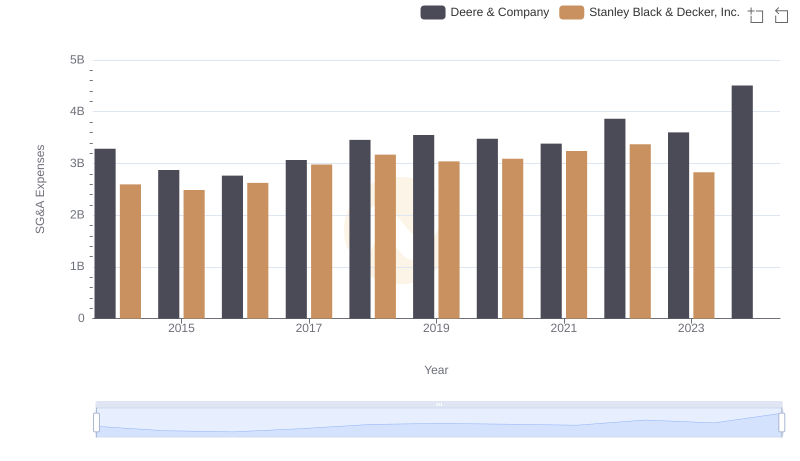
Operational Costs Compared: SG&A Analysis of Deere & Company and Stanley Black & Decker, Inc.
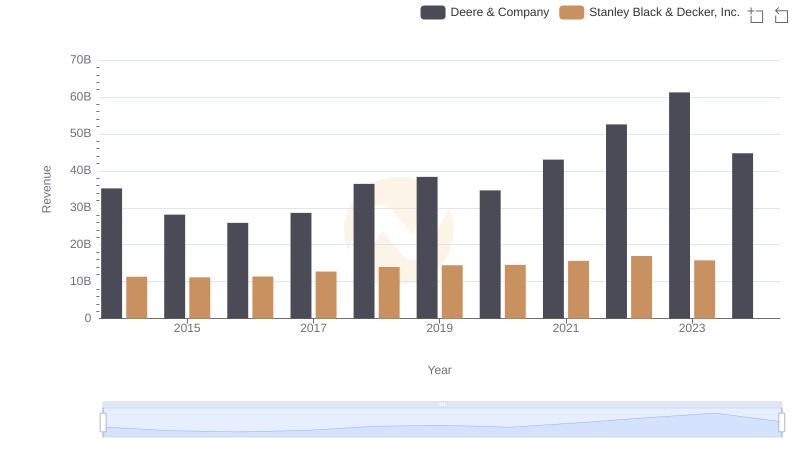
Comparing Revenue Performance: Deere & Company or Stanley Black & Decker, Inc.?
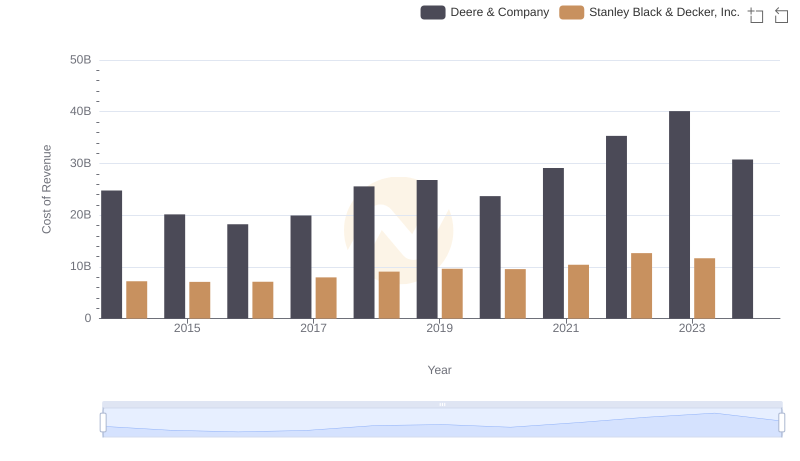
Analyzing Cost of Revenue: Deere & Company and Stanley Black & Decker, Inc.
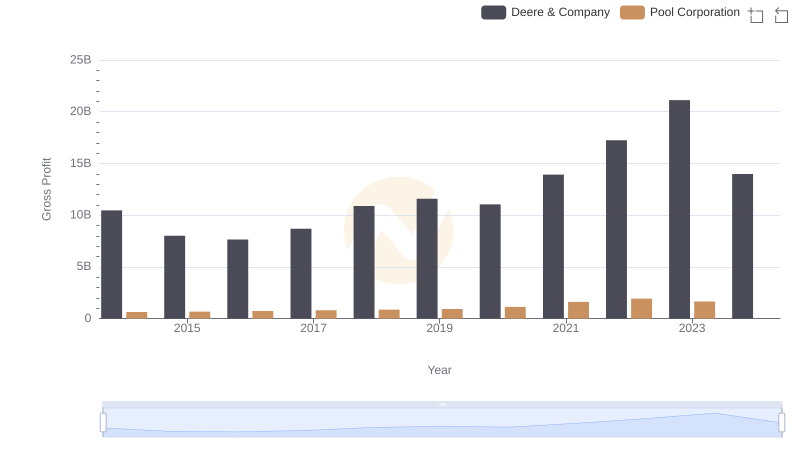
Key Insights on Gross Profit: Deere & Company vs Pool Corporation

Deere & Company vs Stanley Black & Decker, Inc.: SG&A Expense Trends