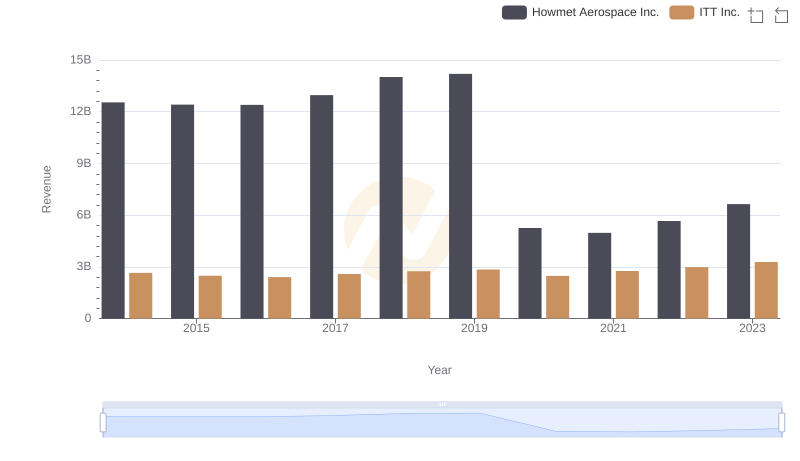
| __timestamp | Howmet Aerospace Inc. | ITT Inc. |
|---|---|---|
| Wednesday, January 1, 2014 | 10349000000 | 1788200000 |
| Thursday, January 1, 2015 | 10104000000 | 1676500000 |
| Friday, January 1, 2016 | 9806000000 | 1647200000 |
| Sunday, January 1, 2017 | 10357000000 | 1768100000 |
| Monday, January 1, 2018 | 11397000000 | 1857900000 |
| Tuesday, January 1, 2019 | 11227000000 | 1936300000 |
| Wednesday, January 1, 2020 | 3878000000 | 1695600000 |
| Friday, January 1, 2021 | 3596000000 | 1865500000 |
| Saturday, January 1, 2022 | 4103000000 | 2065400000 |
| Sunday, January 1, 2023 | 4773000000 | 2175700000 |
| Monday, January 1, 2024 | 5119000000 | 2383400000 |
In pursuit of knowledge
In the competitive landscape of aerospace and engineering, cost efficiency is paramount. This analysis delves into the cost of revenue trends for Howmet Aerospace Inc. and ITT Inc. from 2014 to 2023. Over this period, Howmet Aerospace's cost of revenue fluctuated significantly, peaking in 2018 with a 14% increase from 2014, before dropping sharply by 65% in 2020. This decline coincides with global disruptions, hinting at strategic cost management or external pressures. Conversely, ITT Inc. maintained a more stable trajectory, with a modest 22% increase over the decade, reflecting consistent operational efficiency. The stark contrast in trends highlights Howmet's volatile cost structure compared to ITT's steady approach. As industries evolve, understanding these dynamics offers valuable insights into corporate strategies and market resilience.
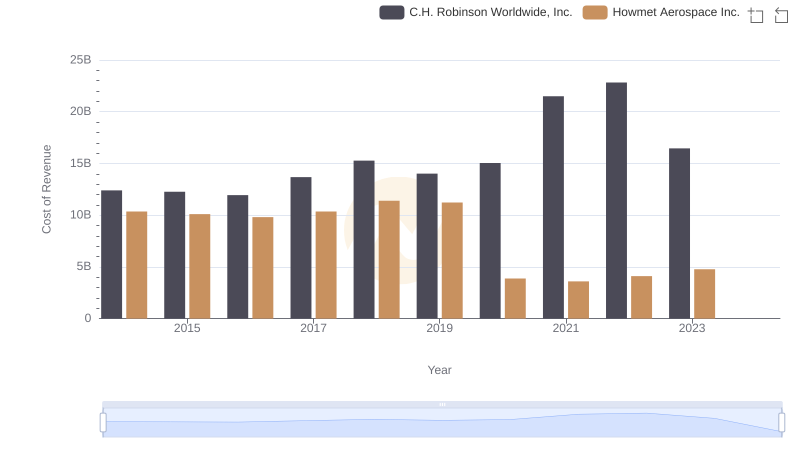
Cost of Revenue Trends: Howmet Aerospace Inc. vs C.H. Robinson Worldwide, Inc.
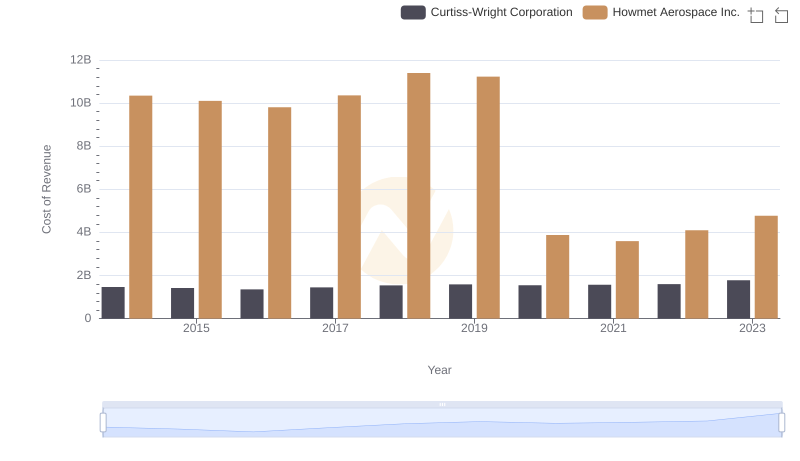
Howmet Aerospace Inc. vs Curtiss-Wright Corporation: Efficiency in Cost of Revenue Explored
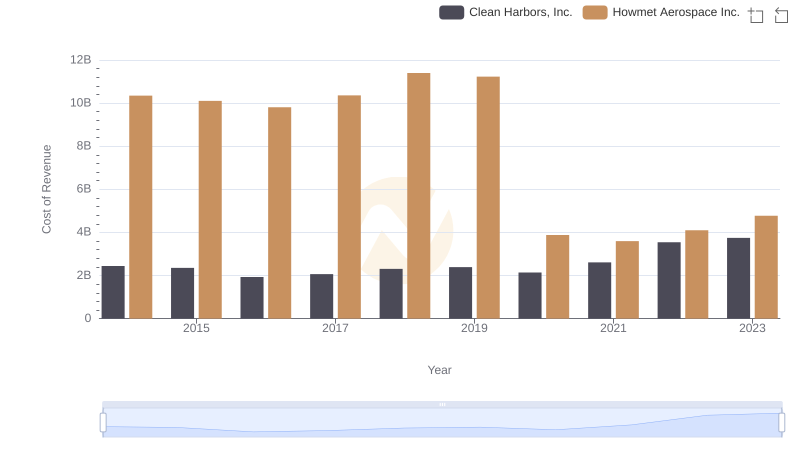
Analyzing Cost of Revenue: Howmet Aerospace Inc. and Clean Harbors, Inc.
Comparing Revenue Performance: Howmet Aerospace Inc. or ITT Inc.?
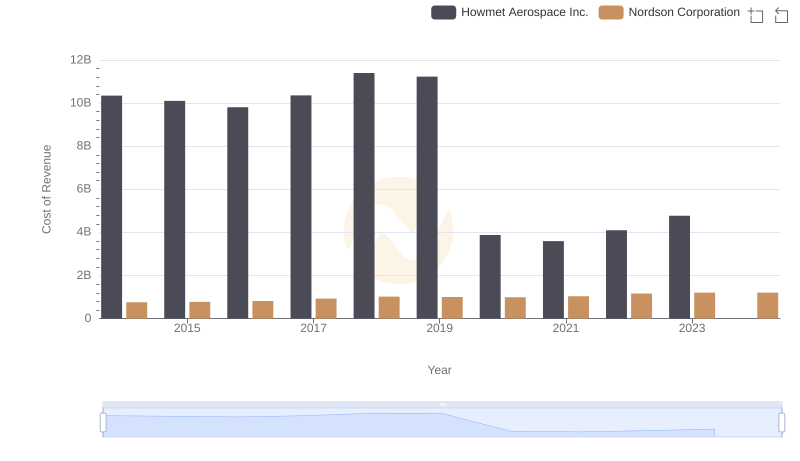
Cost of Revenue Comparison: Howmet Aerospace Inc. vs Nordson Corporation
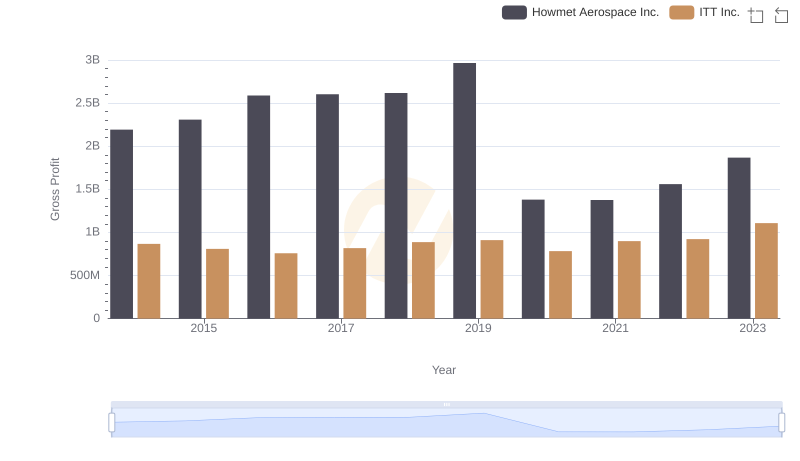
Howmet Aerospace Inc. vs ITT Inc.: A Gross Profit Performance Breakdown
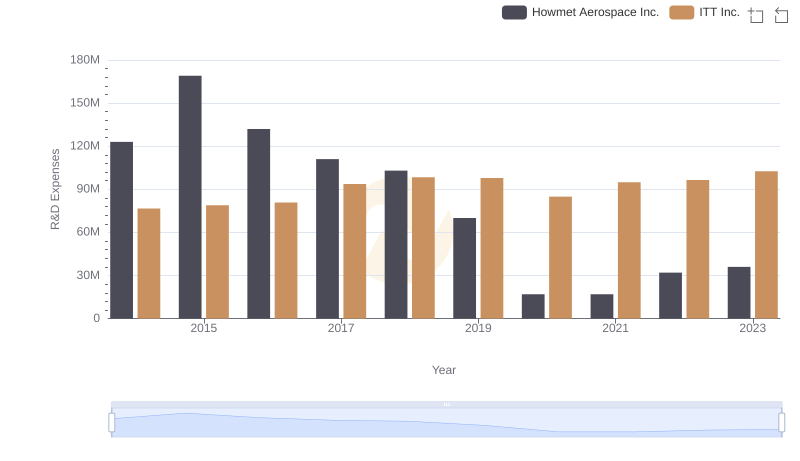
Comparing Innovation Spending: Howmet Aerospace Inc. and ITT Inc.
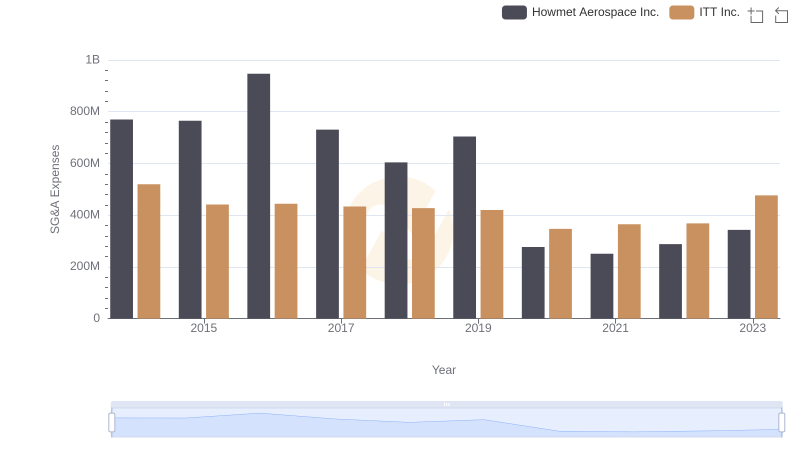
Selling, General, and Administrative Costs: Howmet Aerospace Inc. vs ITT Inc.