| __timestamp | Elbit Systems Ltd. | TransUnion |
|---|---|---|
| Wednesday, January 1, 2014 | 825097000 | 805600000 |
| Thursday, January 1, 2015 | 897053000 | 975200000 |
| Friday, January 1, 2016 | 959583000 | 1125800000 |
| Sunday, January 1, 2017 | 997920000 | 1288100000 |
| Monday, January 1, 2018 | 976179000 | 1527100000 |
| Tuesday, January 1, 2019 | 1136467000 | 1782000000 |
| Wednesday, January 1, 2020 | 1165107000 | 1796200000 |
| Friday, January 1, 2021 | 1358048000 | 1968600000 |
| Saturday, January 1, 2022 | 1373283000 | 2487000000 |
| Sunday, January 1, 2023 | 1482954000 | 2313900000 |
| Monday, January 1, 2024 | 4183800000 |
Cracking the code
In the ever-evolving landscape of global finance, understanding the financial health of companies is crucial. This analysis compares the gross profit trends of TransUnion and Elbit Systems Ltd. from 2014 to 2023. Over this period, TransUnion has shown a remarkable growth trajectory, with its gross profit increasing by approximately 187%, peaking in 2022. Meanwhile, Elbit Systems Ltd. has experienced a steady rise, with a 79% increase in gross profit over the same period.
TransUnion's gross profit surged significantly, especially between 2018 and 2022, reflecting its robust market strategies and expansion. In contrast, Elbit Systems Ltd. maintained a consistent growth pattern, highlighting its stable market presence. The data reveals a fascinating narrative of two companies navigating their financial journeys, offering valuable insights for investors and market analysts alike.
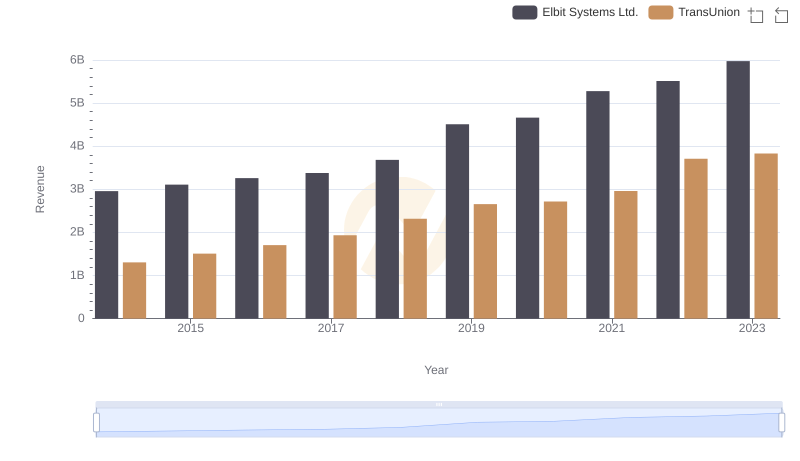
Who Generates More Revenue? TransUnion or Elbit Systems Ltd.
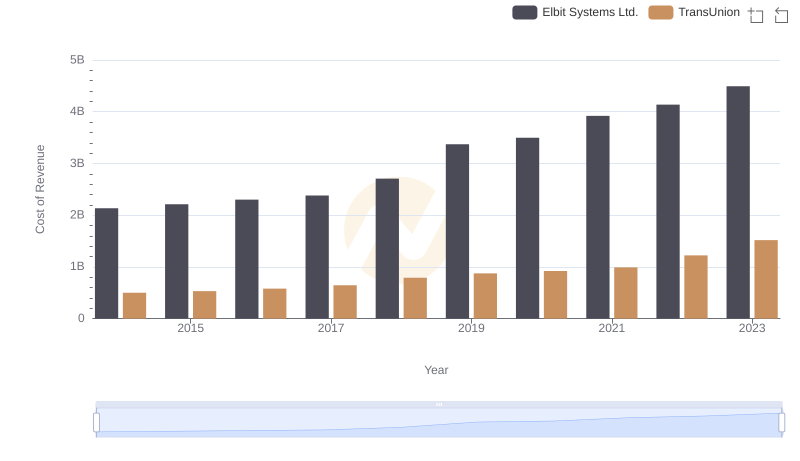
Cost Insights: Breaking Down TransUnion and Elbit Systems Ltd.'s Expenses
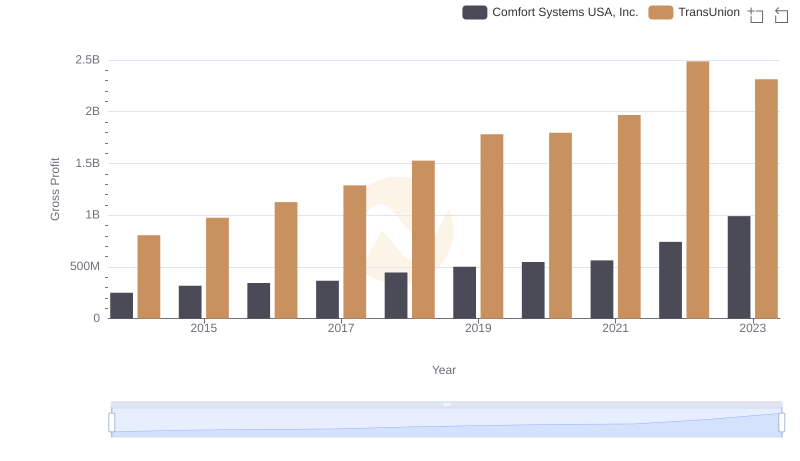
Who Generates Higher Gross Profit? TransUnion or Comfort Systems USA, Inc.
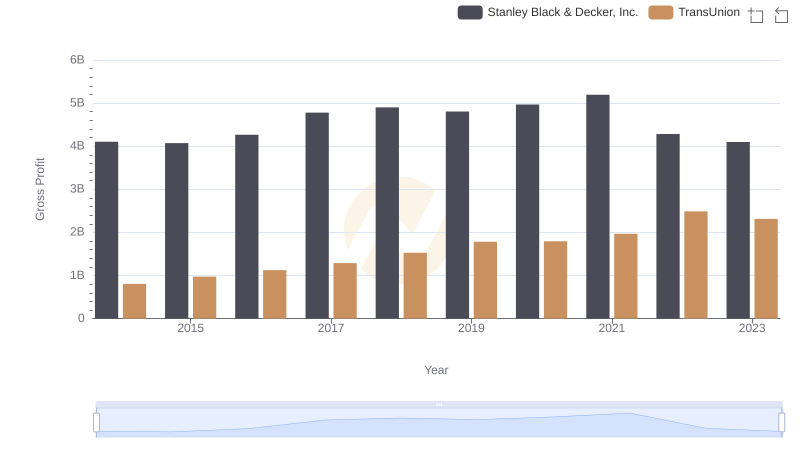
Gross Profit Analysis: Comparing TransUnion and Stanley Black & Decker, Inc.
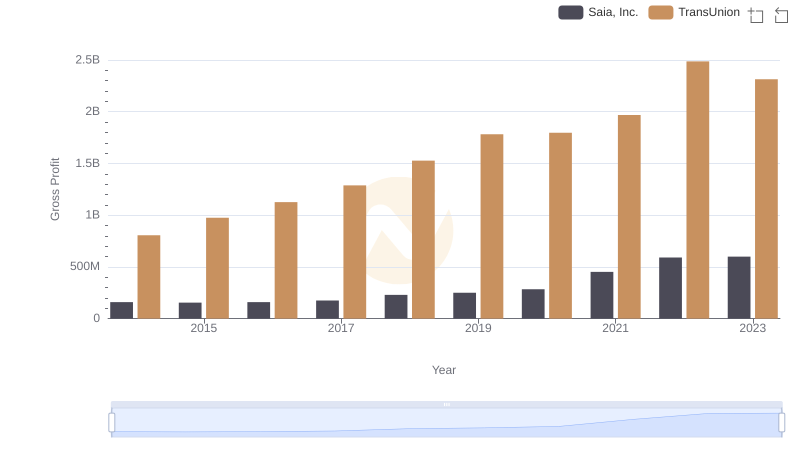
Who Generates Higher Gross Profit? TransUnion or Saia, Inc.

TransUnion vs Curtiss-Wright Corporation: A Gross Profit Performance Breakdown
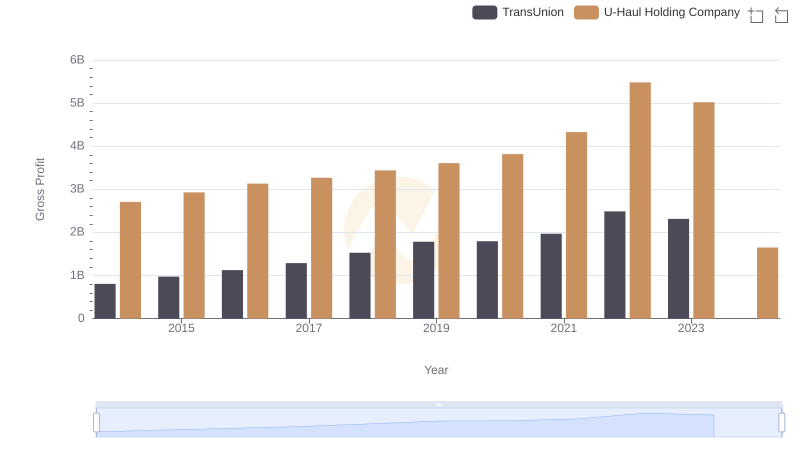
Gross Profit Comparison: TransUnion and U-Haul Holding Company Trends
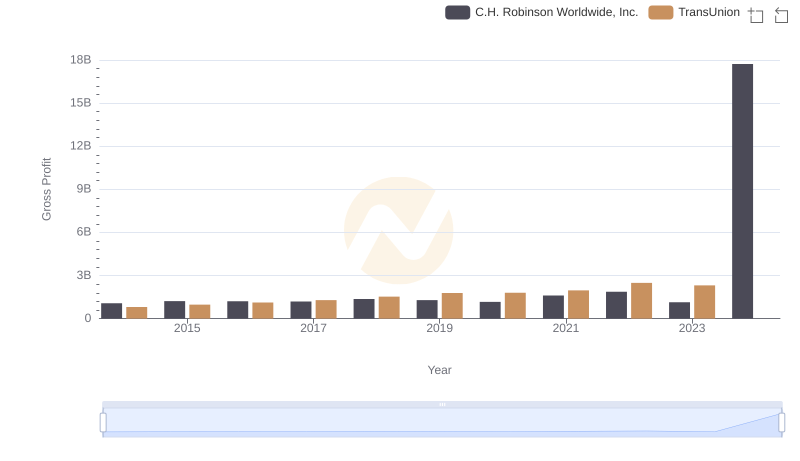
Key Insights on Gross Profit: TransUnion vs C.H. Robinson Worldwide, Inc.
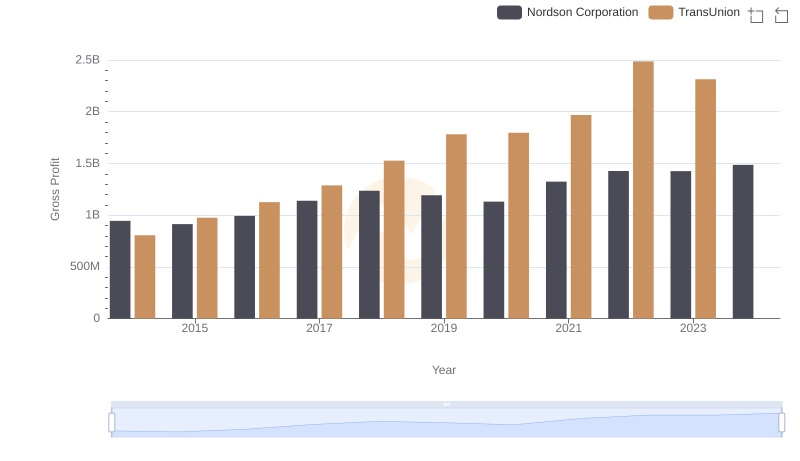
Key Insights on Gross Profit: TransUnion vs Nordson Corporation
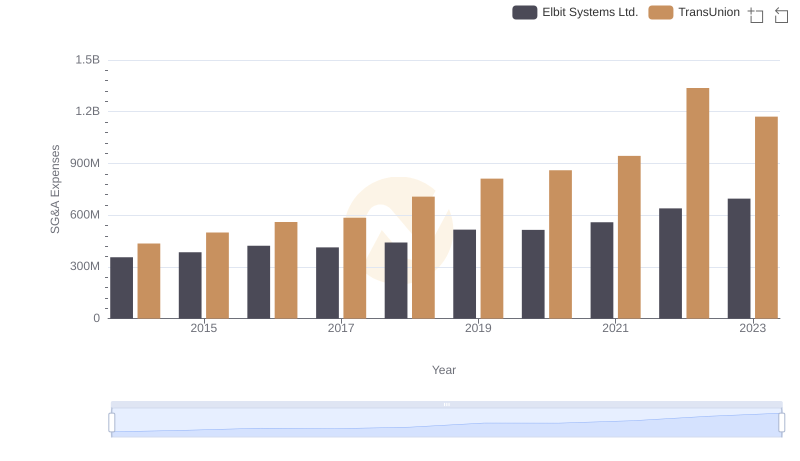
TransUnion or Elbit Systems Ltd.: Who Manages SG&A Costs Better?
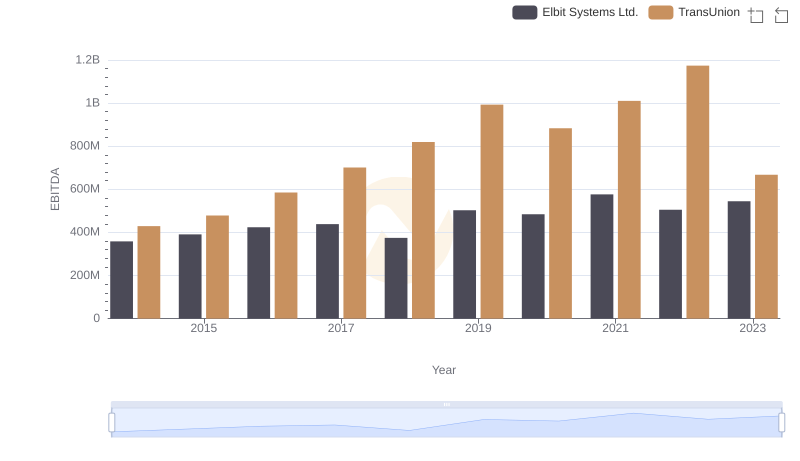
Comprehensive EBITDA Comparison: TransUnion vs Elbit Systems Ltd.