| __timestamp | Expeditors International of Washington, Inc. | Snap-on Incorporated |
|---|---|---|
| Wednesday, January 1, 2014 | 763996000 | 1584300000 |
| Thursday, January 1, 2015 | 895784000 | 1648300000 |
| Friday, January 1, 2016 | 850793000 | 1709600000 |
| Sunday, January 1, 2017 | 883027000 | 1824900000 |
| Monday, January 1, 2018 | 1020282000 | 1870000000 |
| Tuesday, January 1, 2019 | 997021000 | 1844000000 |
| Wednesday, January 1, 2020 | 1162765000 | 1748500000 |
| Friday, January 1, 2021 | 2165412000 | 2110800000 |
| Saturday, January 1, 2022 | 2171130000 | 2181100000 |
| Sunday, January 1, 2023 | 1245476000 | 2619800000 |
| Monday, January 1, 2024 | 10600515000 | 2377900000 |
Data in motion
In the ever-evolving landscape of American business, Snap-on Incorporated and Expeditors International of Washington, Inc. have carved distinct paths in their financial journeys. From 2014 to 2023, Snap-on's gross profit surged by approximately 65%, peaking in 2023 with a remarkable $2.62 billion. This growth reflects Snap-on's robust market strategies and adaptability in the face of economic challenges.
Conversely, Expeditors International experienced a more volatile trajectory. Despite a significant spike in 2021, where gross profit nearly doubled from 2020, the company faced a downturn in 2023, dropping to $1.25 billion. This fluctuation underscores the dynamic nature of the logistics industry, influenced by global supply chain disruptions and market demands.
These trends highlight the contrasting resilience and challenges faced by these industry giants, offering valuable insights into their strategic maneuvers over the past decade.
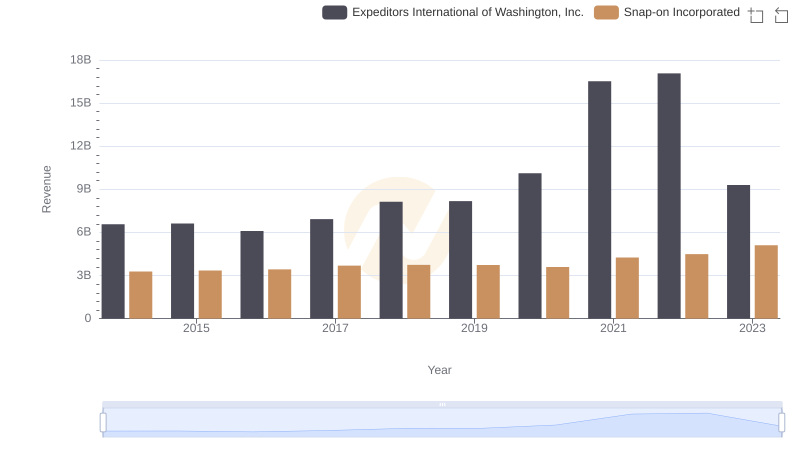
Revenue Showdown: Snap-on Incorporated vs Expeditors International of Washington, Inc.
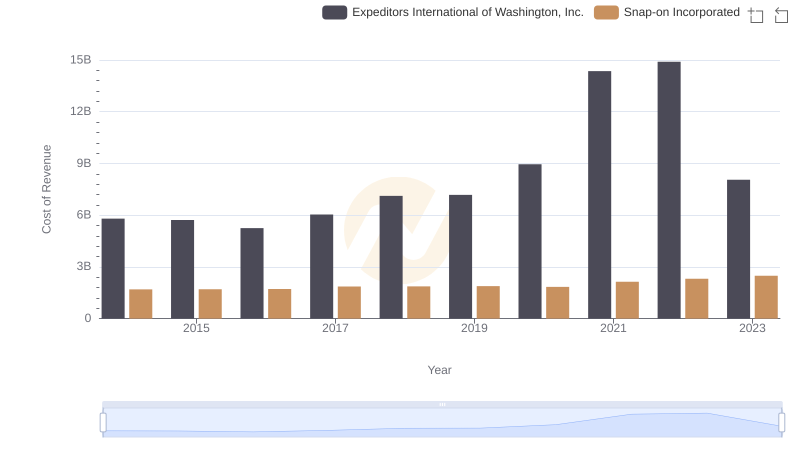
Analyzing Cost of Revenue: Snap-on Incorporated and Expeditors International of Washington, Inc.
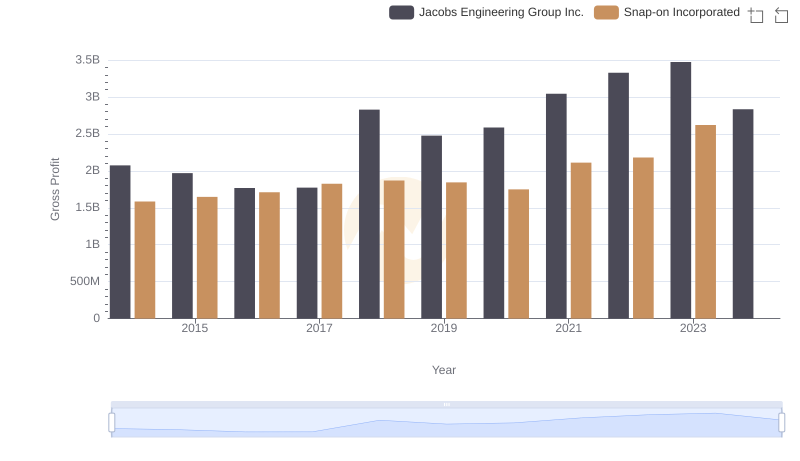
Gross Profit Comparison: Snap-on Incorporated and Jacobs Engineering Group Inc. Trends
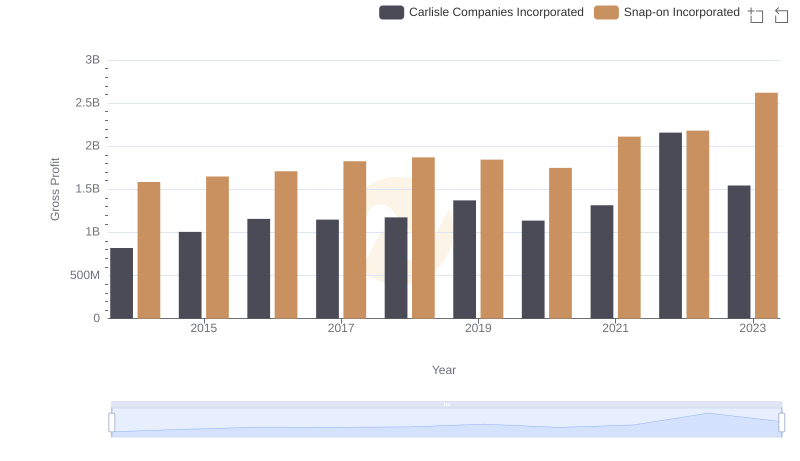
Gross Profit Analysis: Comparing Snap-on Incorporated and Carlisle Companies Incorporated
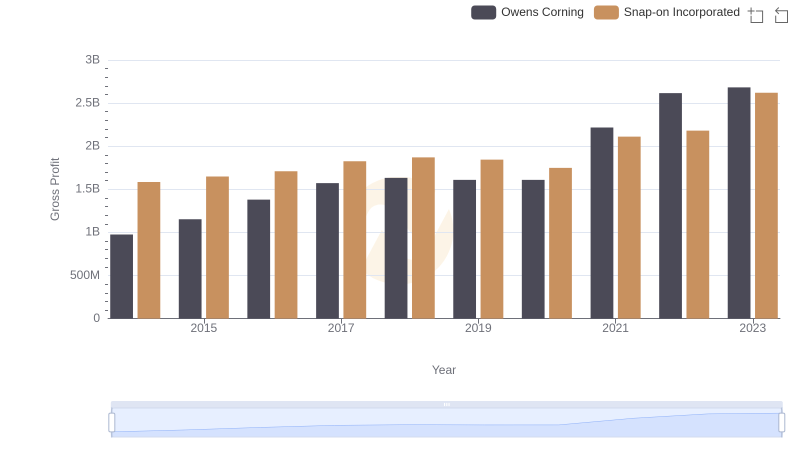
Gross Profit Comparison: Snap-on Incorporated and Owens Corning Trends
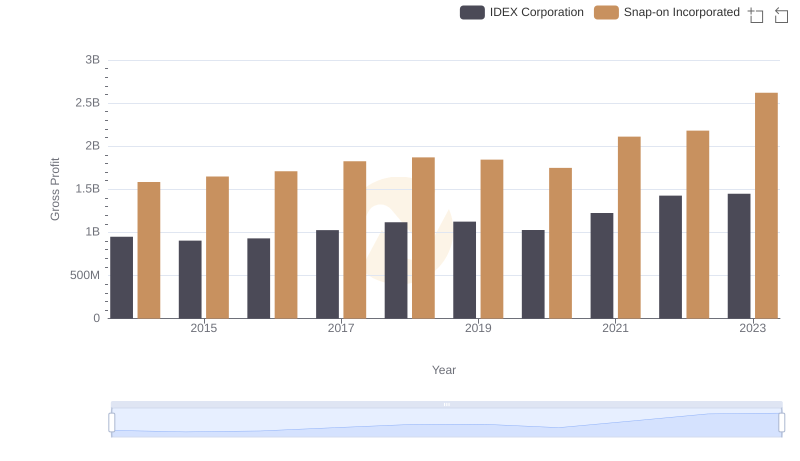
Key Insights on Gross Profit: Snap-on Incorporated vs IDEX Corporation

Snap-on Incorporated vs Booz Allen Hamilton Holding Corporation: A Gross Profit Performance Breakdown
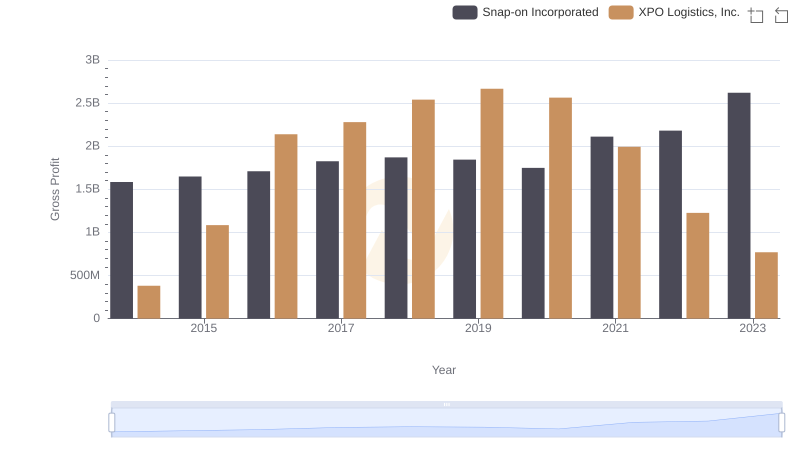
Gross Profit Trends Compared: Snap-on Incorporated vs XPO Logistics, Inc.
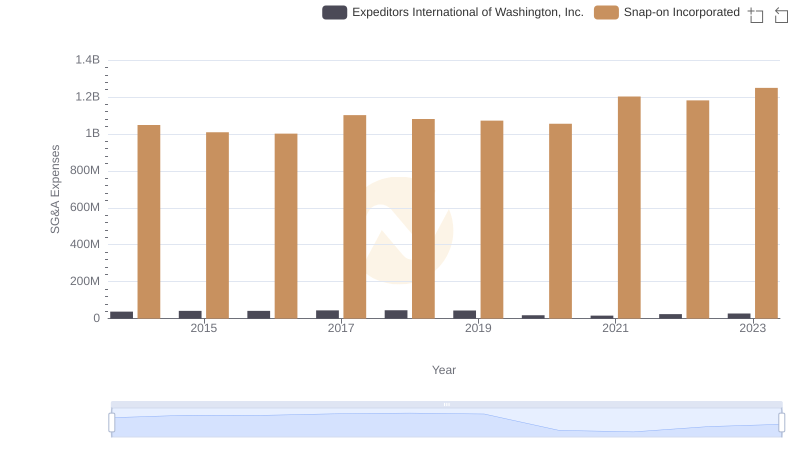
Cost Management Insights: SG&A Expenses for Snap-on Incorporated and Expeditors International of Washington, Inc.
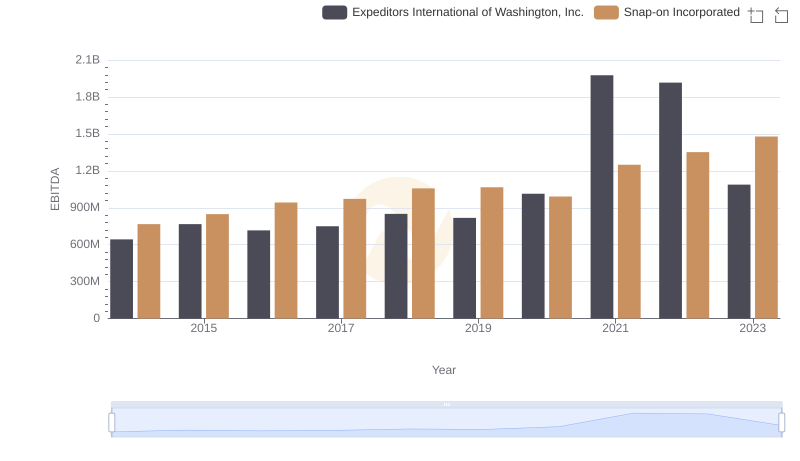
A Professional Review of EBITDA: Snap-on Incorporated Compared to Expeditors International of Washington, Inc.