| __timestamp | Apple Inc. | KLA Corporation |
|---|---|---|
| Wednesday, January 1, 2014 | 70537000000 | 1696446000 |
| Thursday, January 1, 2015 | 93626000000 | 1598820000 |
| Friday, January 1, 2016 | 84263000000 | 1821102000 |
| Sunday, January 1, 2017 | 88186000000 | 2192467000 |
| Monday, January 1, 2018 | 101839000000 | 2589332000 |
| Tuesday, January 1, 2019 | 98392000000 | 2699527000 |
| Wednesday, January 1, 2020 | 104956000000 | 3356863000 |
| Friday, January 1, 2021 | 152836000000 | 4146569000 |
| Saturday, January 1, 2022 | 170782000000 | 5619442000 |
| Sunday, January 1, 2023 | 169148000000 | 6277749000 |
| Monday, January 1, 2024 | 180683000000 | 5884174000 |
Unleashing the power of data
In the ever-evolving landscape of technology, the financial performance of industry giants like Apple Inc. and KLA Corporation offers a fascinating glimpse into their growth trajectories. Over the past decade, from 2014 to 2024, Apple Inc. has consistently demonstrated robust financial health, with its gross profit soaring by approximately 156%, from $70.5 billion in 2014 to an impressive $180.7 billion in 2024. This growth underscores Apple's dominance in the tech sector, driven by its innovative product line and global market reach.
Conversely, KLA Corporation, a key player in semiconductor manufacturing, has experienced a more modest yet steady increase in gross profit, growing nearly 247% from $1.7 billion in 2014 to $5.9 billion in 2024. This growth reflects the rising demand for semiconductor equipment, crucial for the digital age. The contrasting growth rates highlight the diverse dynamics within the tech industry, where both consumer electronics and semiconductor sectors play pivotal roles.
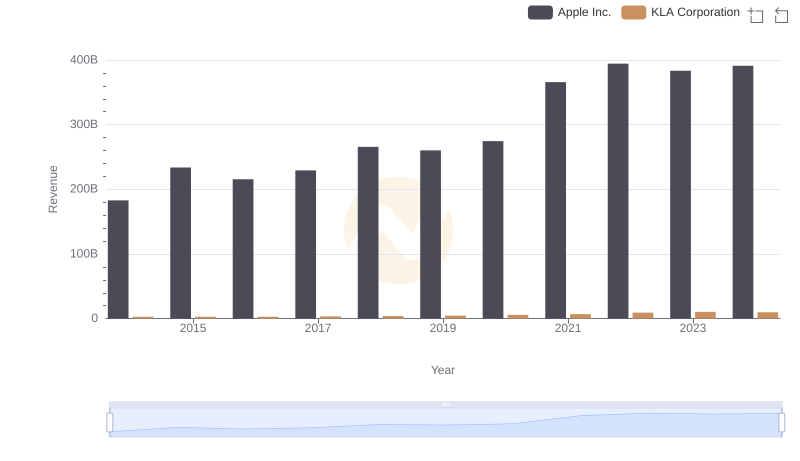
Comparing Revenue Performance: Apple Inc. or KLA Corporation?
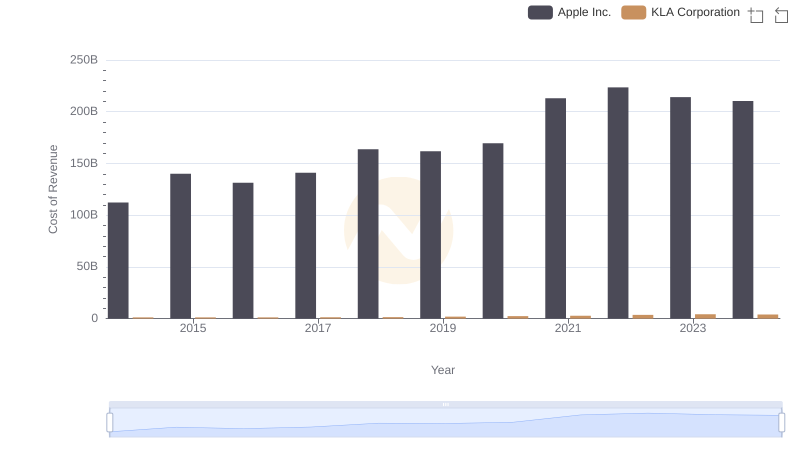
Apple Inc. vs KLA Corporation: Efficiency in Cost of Revenue Explored
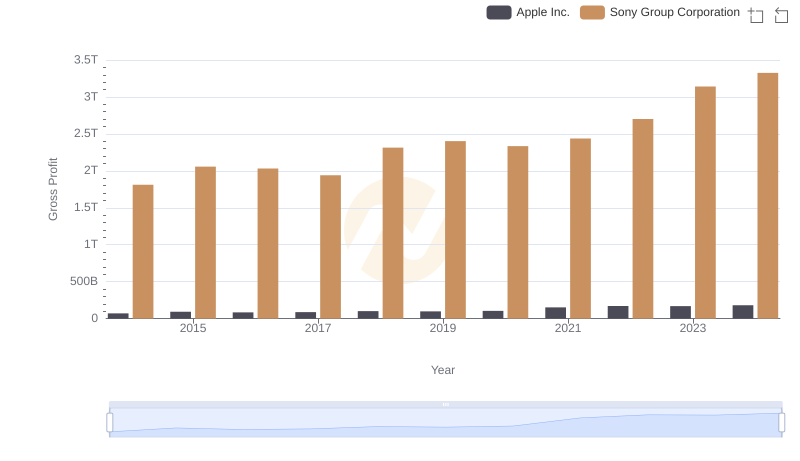
Gross Profit Comparison: Apple Inc. and Sony Group Corporation Trends

Gross Profit Analysis: Comparing Apple Inc. and Applied Materials, Inc.
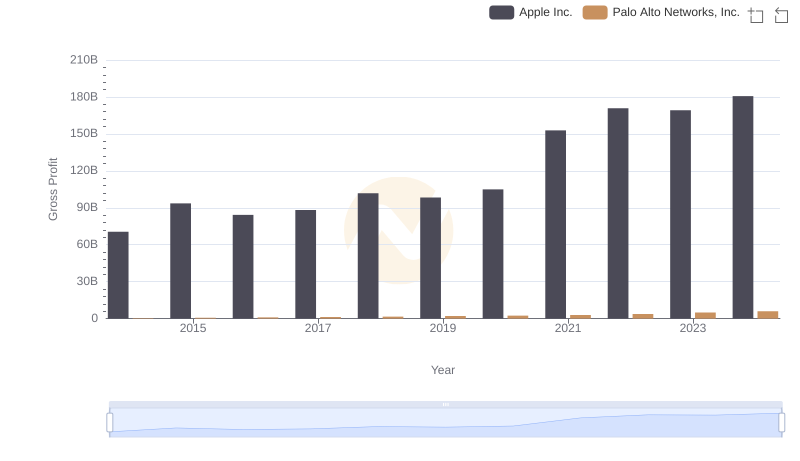
Gross Profit Comparison: Apple Inc. and Palo Alto Networks, Inc. Trends
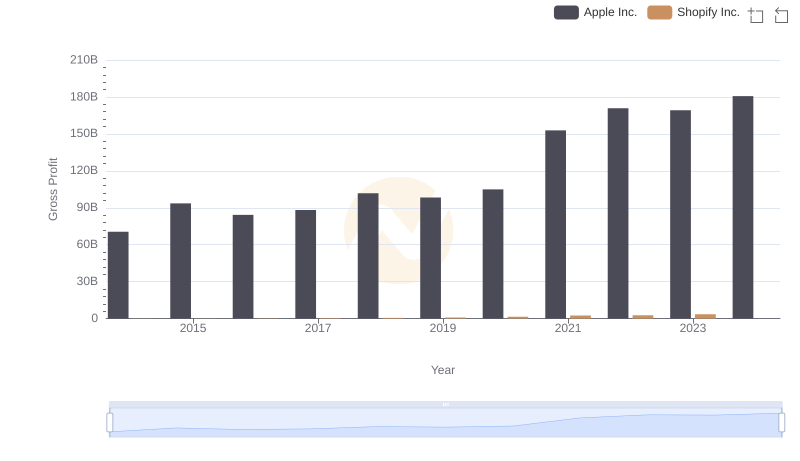
Key Insights on Gross Profit: Apple Inc. vs Shopify Inc.
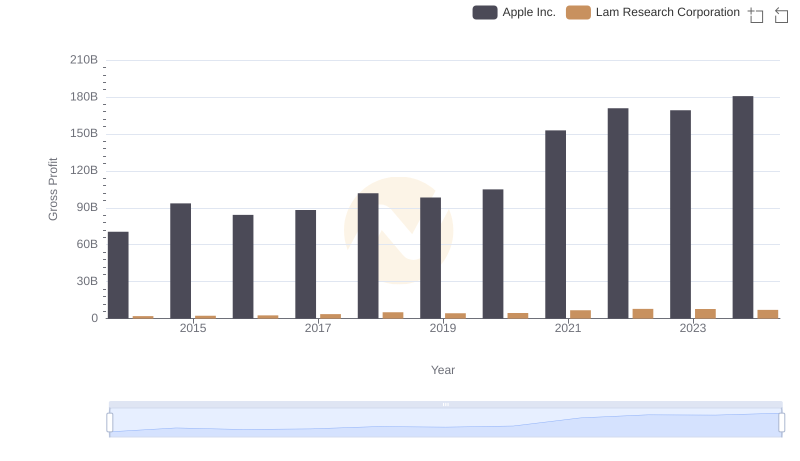
Key Insights on Gross Profit: Apple Inc. vs Lam Research Corporation
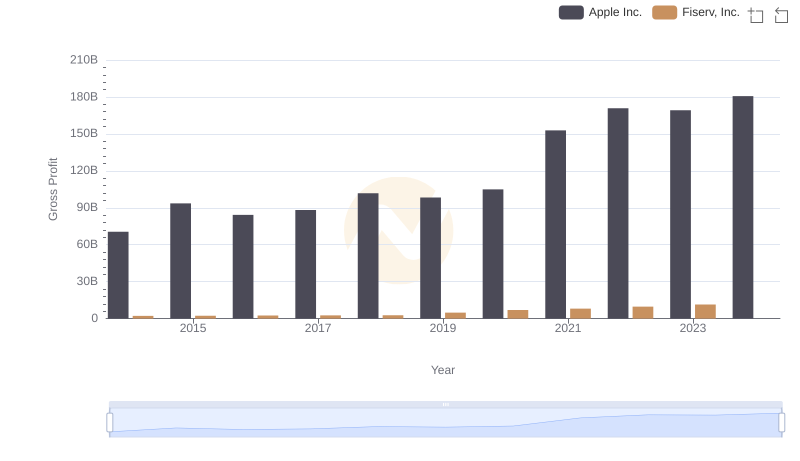
Apple Inc. and Fiserv, Inc.: A Detailed Gross Profit Analysis
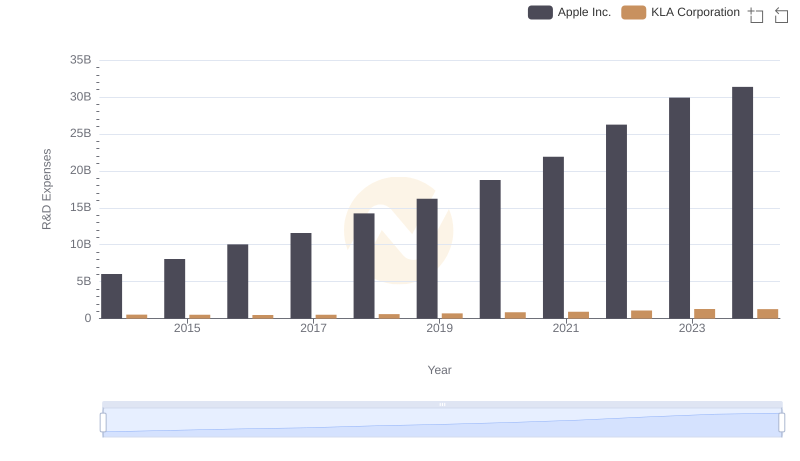
Who Prioritizes Innovation? R&D Spending Compared for Apple Inc. and KLA Corporation
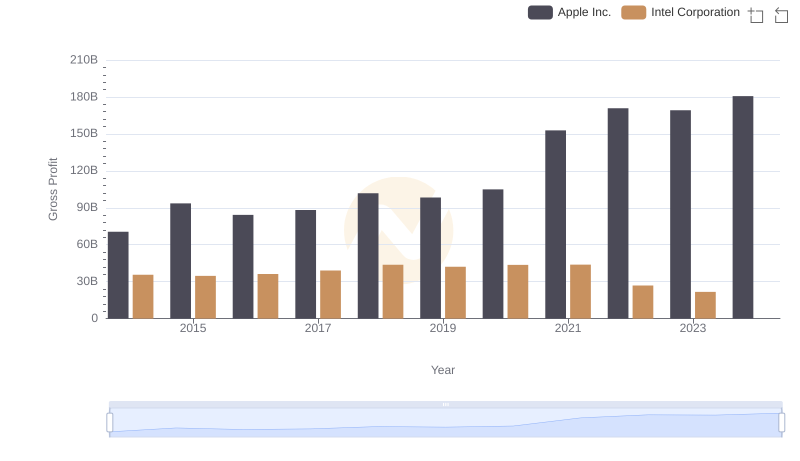
Who Generates Higher Gross Profit? Apple Inc. or Intel Corporation
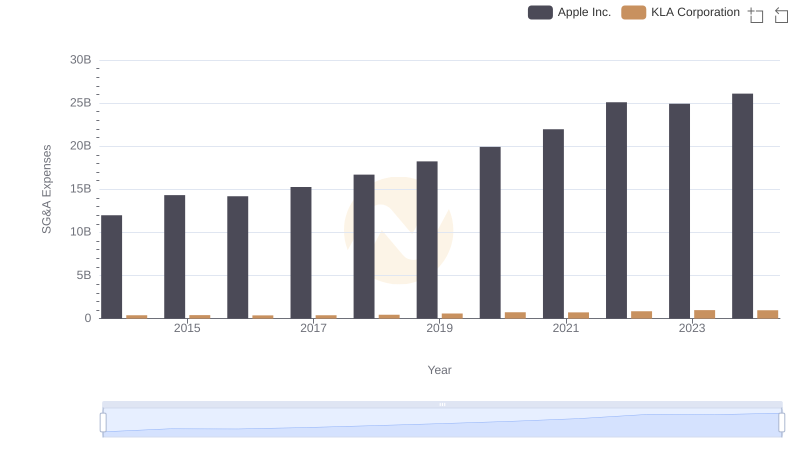
Cost Management Insights: SG&A Expenses for Apple Inc. and KLA Corporation
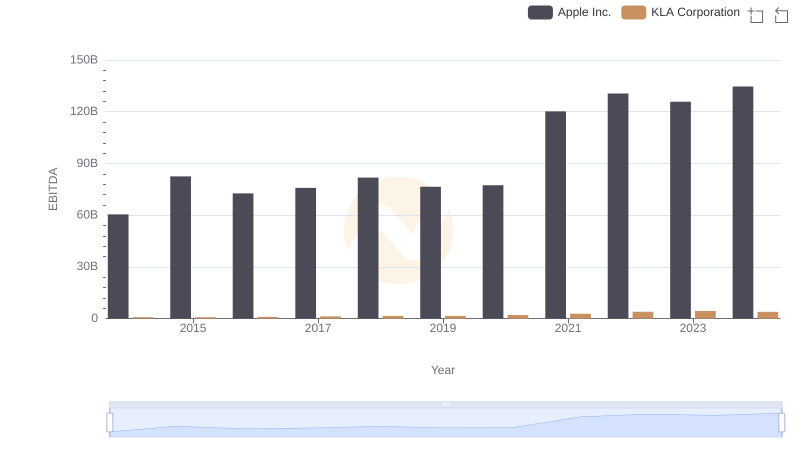
Comparative EBITDA Analysis: Apple Inc. vs KLA Corporation