| __timestamp | Avery Dennison Corporation | TransUnion |
|---|---|---|
| Wednesday, January 1, 2014 | 1651200000 | 805600000 |
| Thursday, January 1, 2015 | 1645800000 | 975200000 |
| Friday, January 1, 2016 | 1699700000 | 1125800000 |
| Sunday, January 1, 2017 | 1812200000 | 1288100000 |
| Monday, January 1, 2018 | 1915500000 | 1527100000 |
| Tuesday, January 1, 2019 | 1904100000 | 1782000000 |
| Wednesday, January 1, 2020 | 1923300000 | 1796200000 |
| Friday, January 1, 2021 | 2312800000 | 1968600000 |
| Saturday, January 1, 2022 | 2404200000 | 2487000000 |
| Sunday, January 1, 2023 | 2277499999 | 2313900000 |
| Monday, January 1, 2024 | 2530700000 | 4183800000 |
Unleashing the power of data
In the ever-evolving landscape of corporate finance, the gross profit trends of TransUnion and Avery Dennison Corporation offer a fascinating glimpse into their financial health over the past decade. From 2014 to 2023, Avery Dennison's gross profit grew by approximately 38%, peaking in 2022. Meanwhile, TransUnion's gross profit surged by over 200%, surpassing Avery Dennison in 2022. This remarkable growth trajectory highlights TransUnion's aggressive expansion and strategic positioning in the market.
Avery Dennison, a leader in labeling and packaging materials, maintained steady growth, reflecting its resilience and adaptability in a competitive industry. On the other hand, TransUnion, a global information and insights company, capitalized on the increasing demand for data-driven solutions, driving its impressive profit growth.
As we look to the future, these trends underscore the dynamic nature of the business world, where innovation and strategic foresight are key to sustained success.
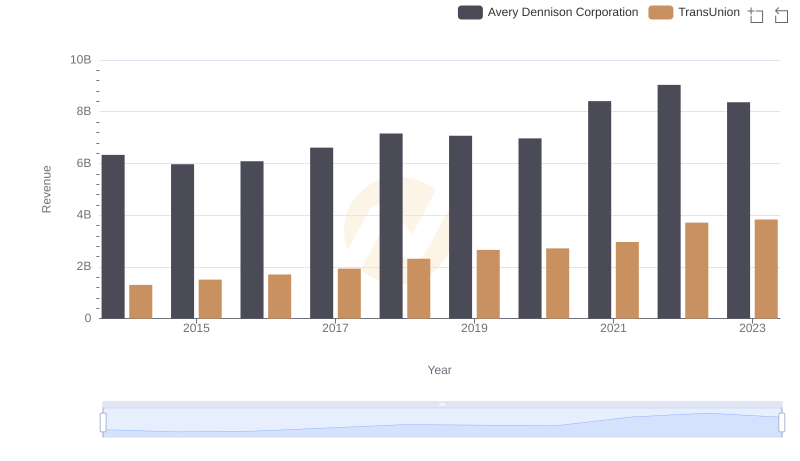
TransUnion or Avery Dennison Corporation: Who Leads in Yearly Revenue?
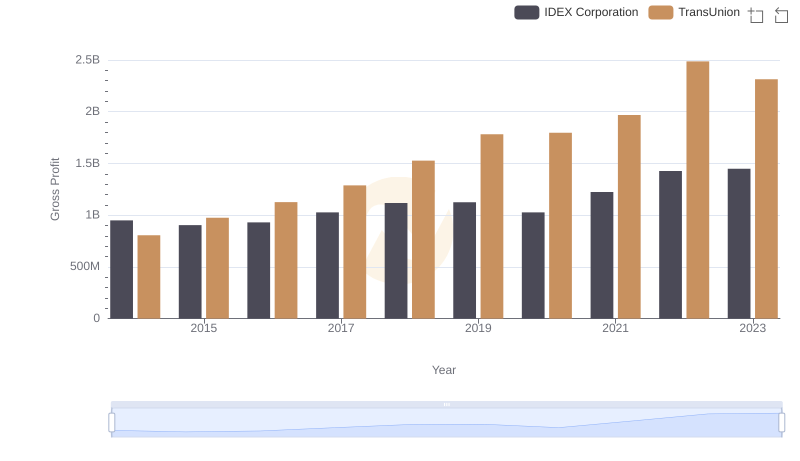
TransUnion vs IDEX Corporation: A Gross Profit Performance Breakdown
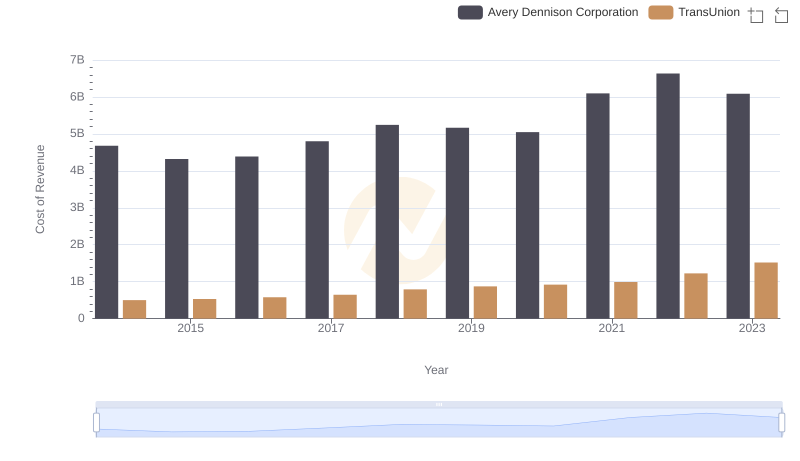
Cost of Revenue: Key Insights for TransUnion and Avery Dennison Corporation
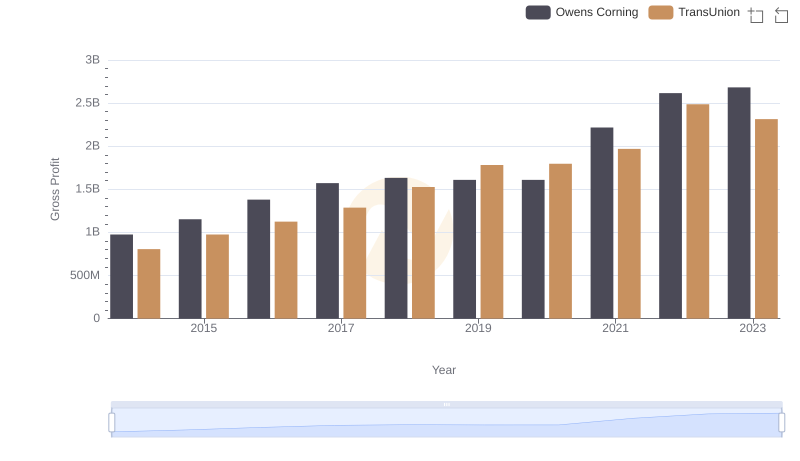
Gross Profit Trends Compared: TransUnion vs Owens Corning
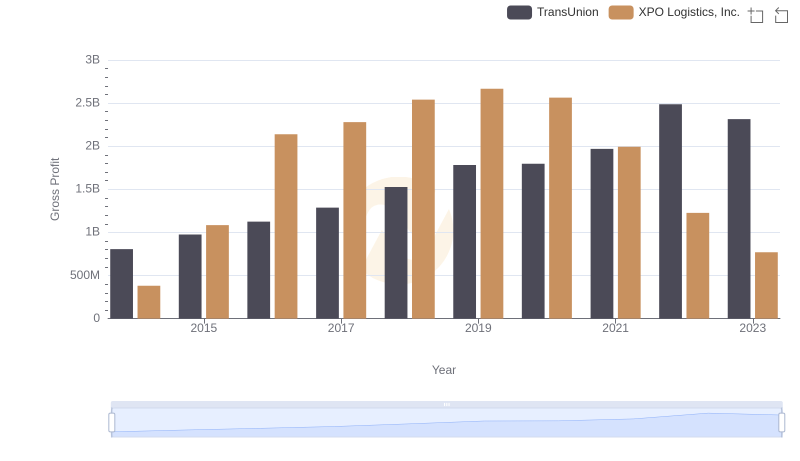
Gross Profit Comparison: TransUnion and XPO Logistics, Inc. Trends
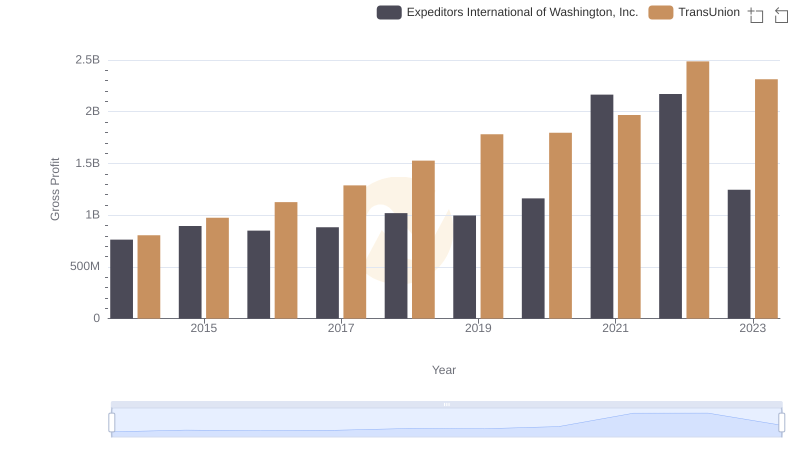
TransUnion vs Expeditors International of Washington, Inc.: A Gross Profit Performance Breakdown
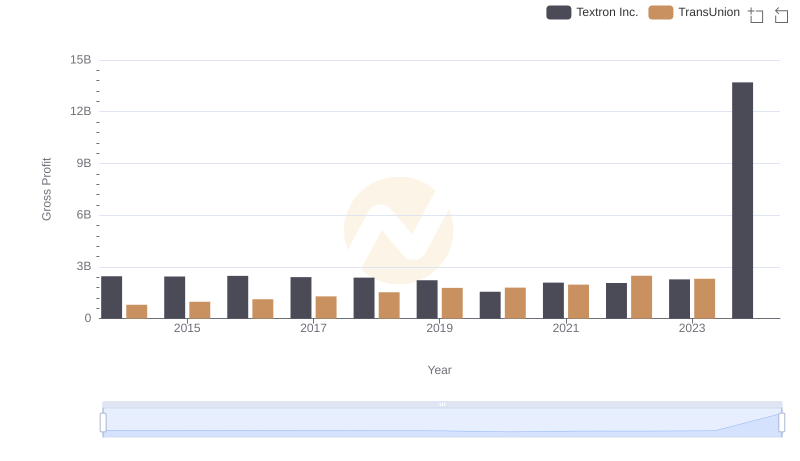
Gross Profit Trends Compared: TransUnion vs Textron Inc.
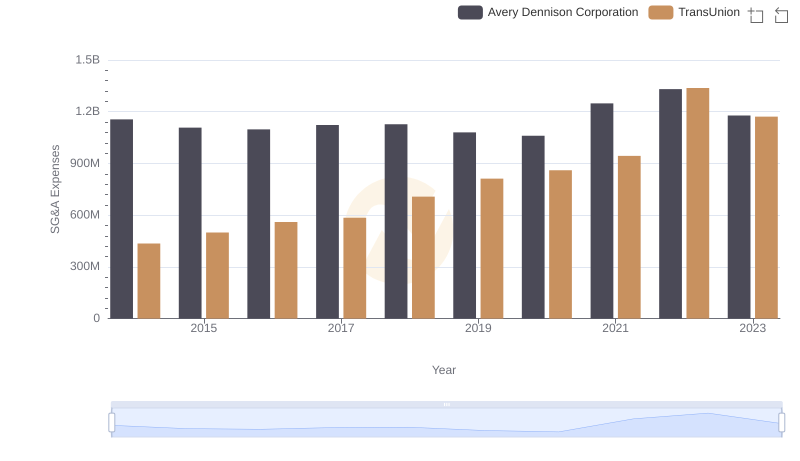
Comparing SG&A Expenses: TransUnion vs Avery Dennison Corporation Trends and Insights
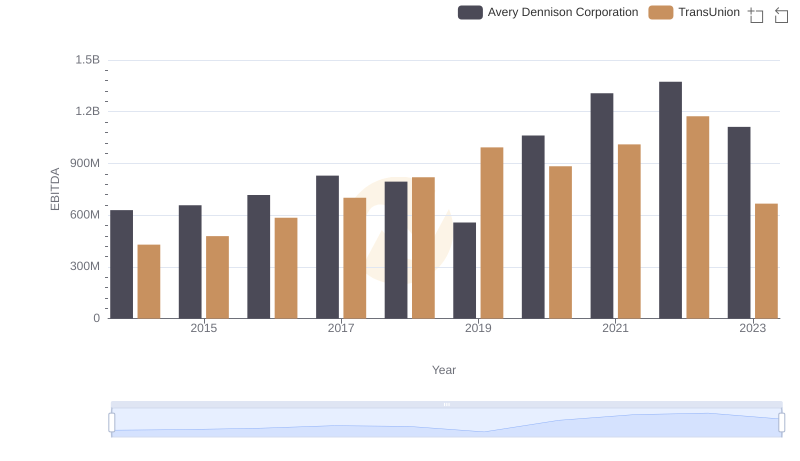
Comprehensive EBITDA Comparison: TransUnion vs Avery Dennison Corporation