| __timestamp | Synopsys, Inc. | Western Digital Corporation |
|---|---|---|
| Wednesday, January 1, 2014 | 1600587000 | 4360000000 |
| Thursday, January 1, 2015 | 1723291000 | 4221000000 |
| Friday, January 1, 2016 | 1879570000 | 3435000000 |
| Sunday, January 1, 2017 | 2070696000 | 6072000000 |
| Monday, January 1, 2018 | 2385160000 | 7705000000 |
| Tuesday, January 1, 2019 | 2607748000 | 3752000000 |
| Wednesday, January 1, 2020 | 2890591000 | 3781000000 |
| Friday, January 1, 2021 | 3342416000 | 4521000000 |
| Saturday, January 1, 2022 | 4017845000 | 5874000000 |
| Sunday, January 1, 2023 | 4620426000 | 1887000000 |
| Monday, January 1, 2024 | 4882147000 | 2945000000 |
Unleashing the power of data
In the ever-evolving landscape of technology, understanding financial trends is crucial. This chart offers a fascinating glimpse into the gross profit trajectories of Synopsys, Inc. and Western Digital Corporation from 2014 to 2024. Over this decade, Synopsys, Inc. has seen a remarkable growth of approximately 205%, with gross profits rising from $1.6 billion in 2014 to an impressive $4.9 billion in 2024. In contrast, Western Digital Corporation experienced a more volatile journey, peaking in 2018 with a gross profit of $7.7 billion, before declining to $2.9 billion in 2024, a drop of about 62% from its peak. This divergence highlights the dynamic nature of the tech industry, where strategic decisions and market conditions can lead to vastly different financial outcomes. Explore these trends to gain insights into the financial health and strategic directions of these tech giants.
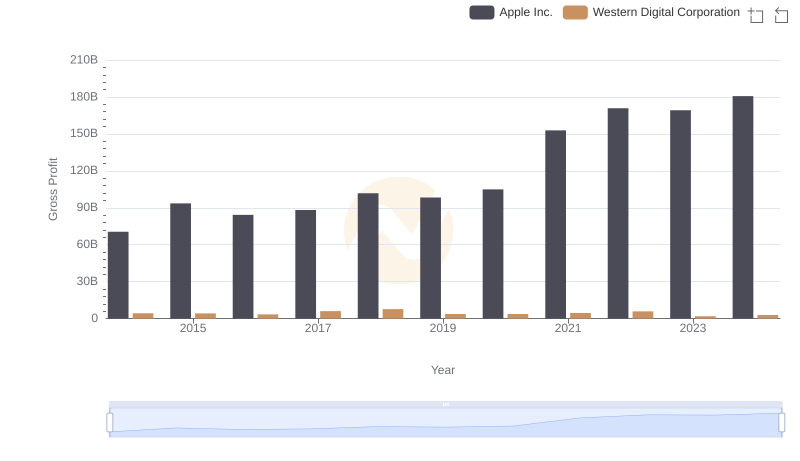
Gross Profit Analysis: Comparing Apple Inc. and Western Digital Corporation
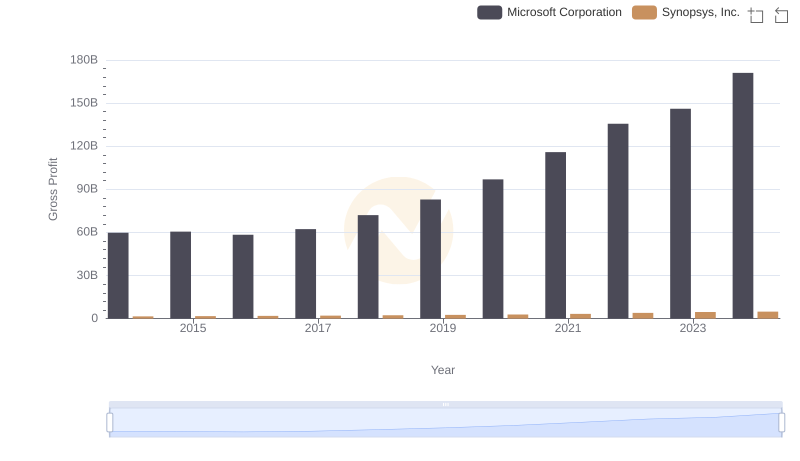
Microsoft Corporation vs Synopsys, Inc.: A Gross Profit Performance Breakdown
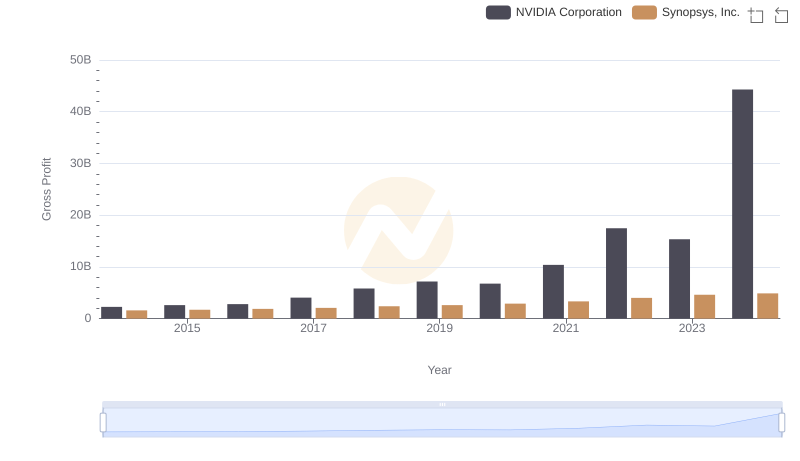
NVIDIA Corporation vs Synopsys, Inc.: A Gross Profit Performance Breakdown
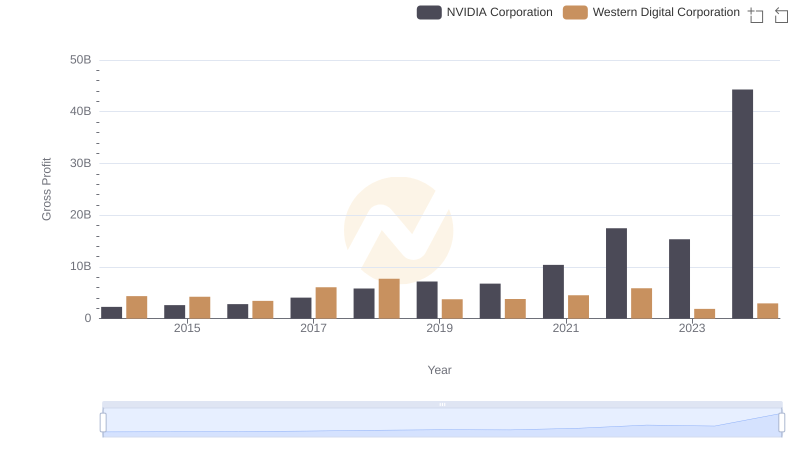
NVIDIA Corporation and Western Digital Corporation: A Detailed Gross Profit Analysis
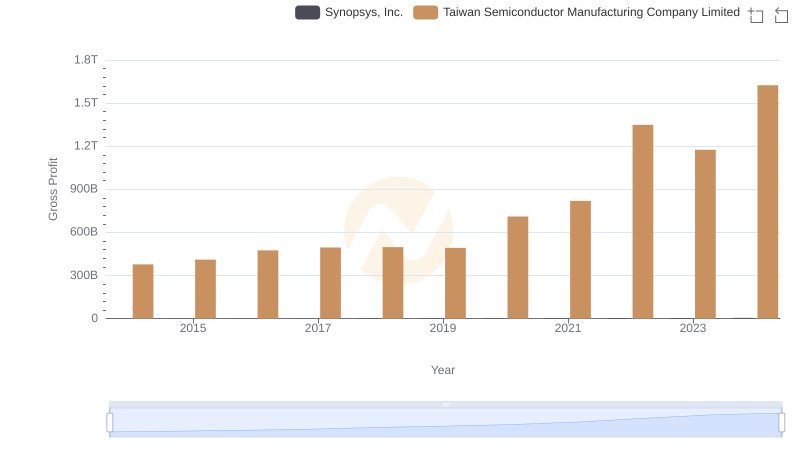
Gross Profit Comparison: Taiwan Semiconductor Manufacturing Company Limited and Synopsys, Inc. Trends
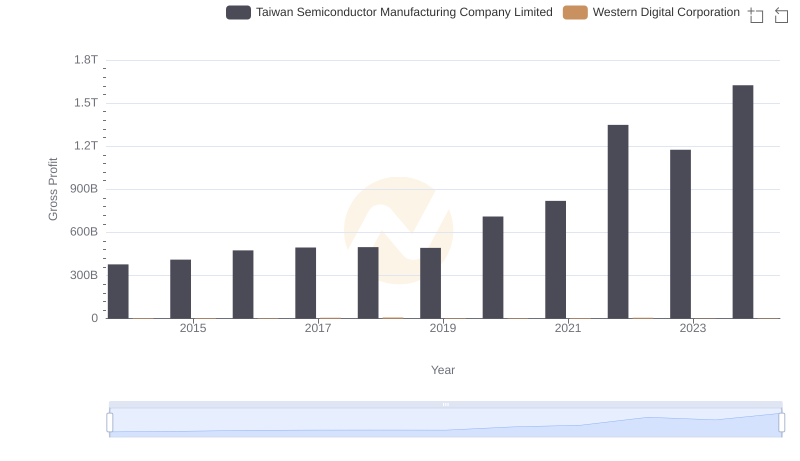
Taiwan Semiconductor Manufacturing Company Limited vs Western Digital Corporation: A Gross Profit Performance Breakdown
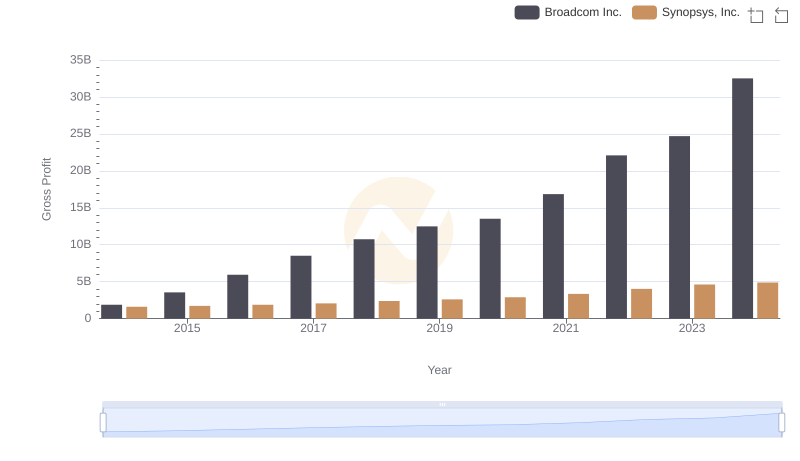
Broadcom Inc. vs Synopsys, Inc.: A Gross Profit Performance Breakdown
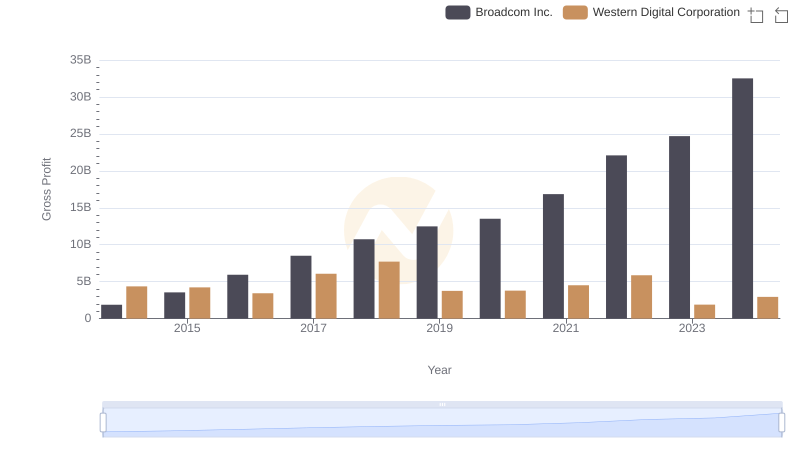
Gross Profit Analysis: Comparing Broadcom Inc. and Western Digital Corporation
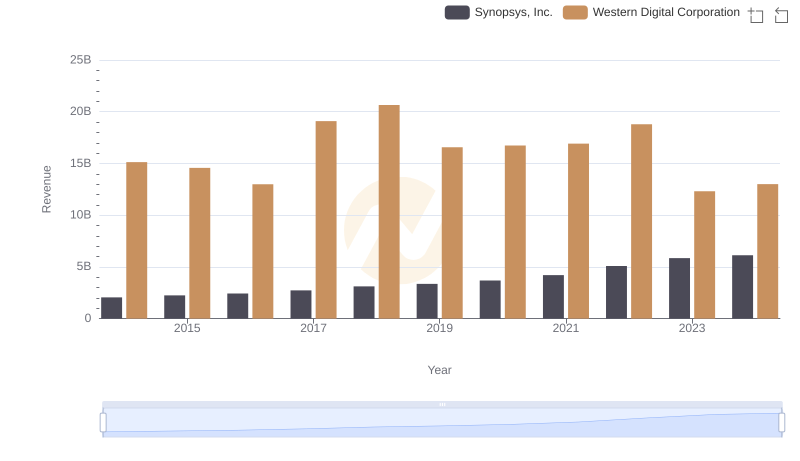
Who Generates More Revenue? Synopsys, Inc. or Western Digital Corporation
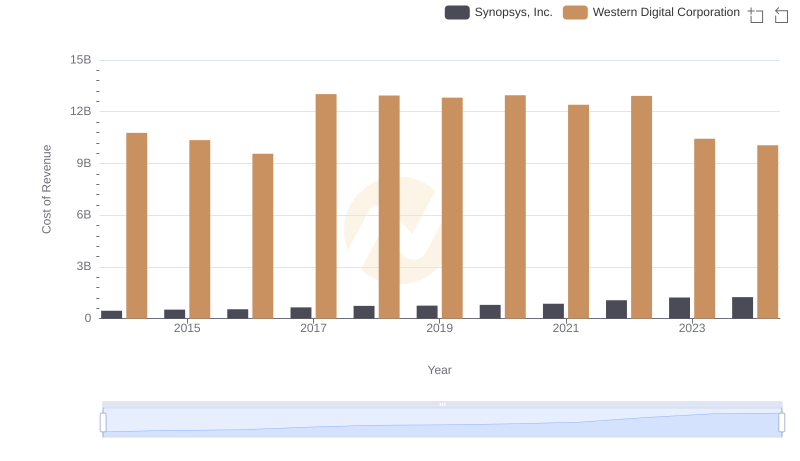
Cost of Revenue Comparison: Synopsys, Inc. vs Western Digital Corporation
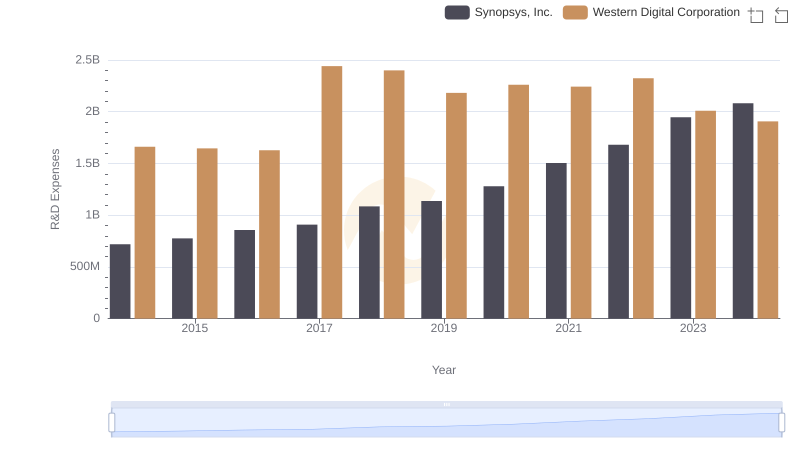
R&D Spending Showdown: Synopsys, Inc. vs Western Digital Corporation
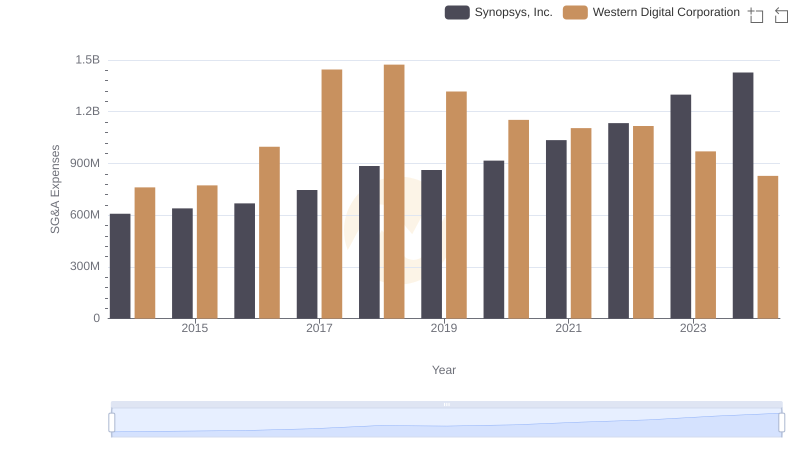
Synopsys, Inc. or Western Digital Corporation: Who Manages SG&A Costs Better?