| __timestamp | Cognizant Technology Solutions Corporation | CyberArk Software Ltd. |
|---|---|---|
| Wednesday, January 1, 2014 | 4121563000 | 88292000 |
| Thursday, January 1, 2015 | 4975800000 | 138152000 |
| Friday, January 1, 2016 | 5379000000 | 186462000 |
| Sunday, January 1, 2017 | 5658000000 | 219853000 |
| Monday, January 1, 2018 | 6287000000 | 294738000 |
| Tuesday, January 1, 2019 | 6149000000 | 371280000 |
| Wednesday, January 1, 2020 | 5981000000 | 381860000 |
| Friday, January 1, 2021 | 6903000000 | 409610000 |
| Saturday, January 1, 2022 | 6980000000 | 465664000 |
| Sunday, January 1, 2023 | 6689000000 | 595757000 |
| Monday, January 1, 2024 | 6778000000 | 785264000 |
Cracking the code
In the ever-evolving tech landscape, Cognizant Technology Solutions Corporation and CyberArk Software Ltd. have showcased distinct growth trajectories over the past decade. From 2014 to 2023, Cognizant's gross profit surged by approximately 62%, peaking in 2022. This growth reflects its robust expansion strategies and market adaptability. Meanwhile, CyberArk, a leader in cybersecurity, demonstrated an impressive 575% increase in gross profit, underscoring the rising demand for cybersecurity solutions in a digital-first world.
Cognizant's gross profit consistently outpaced CyberArk's, highlighting its established market presence. However, CyberArk's rapid growth rate signals its potential to capture a larger market share in the coming years. As we look to the future, these trends suggest a dynamic shift in the tech industry, where innovation and security are paramount. Investors and industry watchers should keep a keen eye on these companies as they navigate the challenges and opportunities of the digital age.
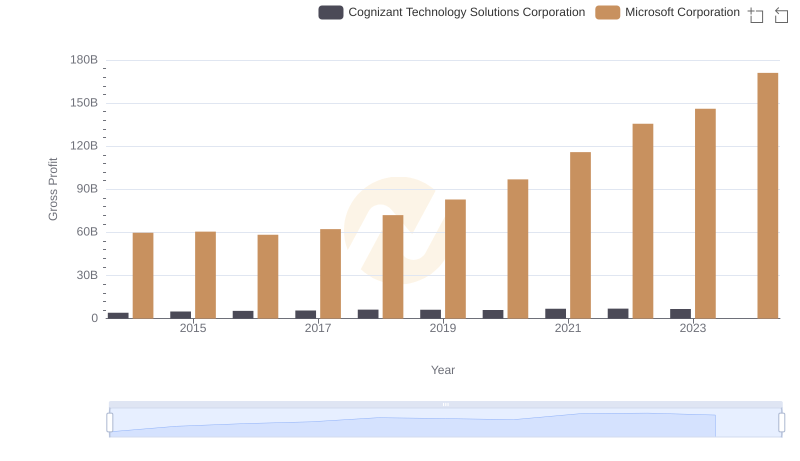
Key Insights on Gross Profit: Microsoft Corporation vs Cognizant Technology Solutions Corporation
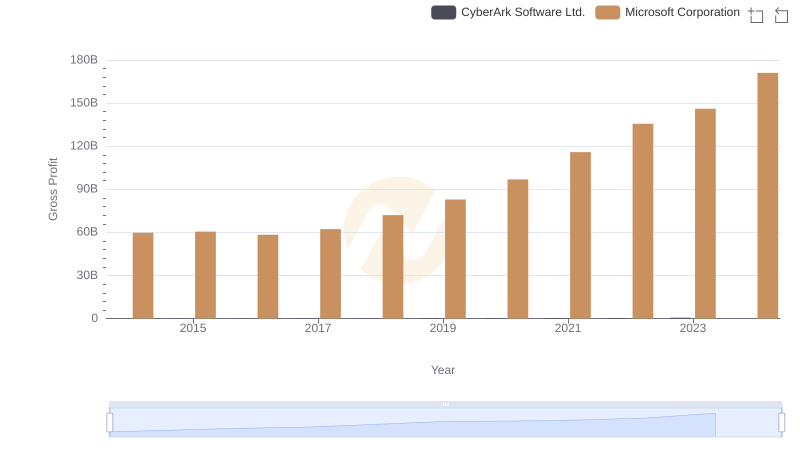
Who Generates Higher Gross Profit? Microsoft Corporation or CyberArk Software Ltd.

Gross Profit Comparison: NVIDIA Corporation and CyberArk Software Ltd. Trends
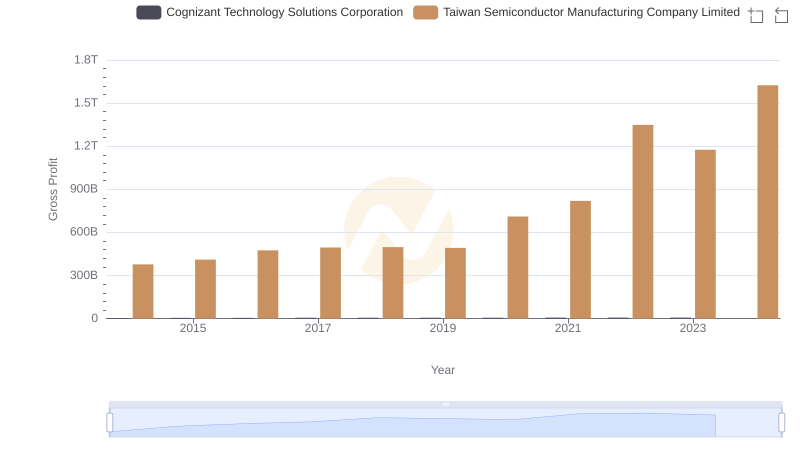
Who Generates Higher Gross Profit? Taiwan Semiconductor Manufacturing Company Limited or Cognizant Technology Solutions Corporation
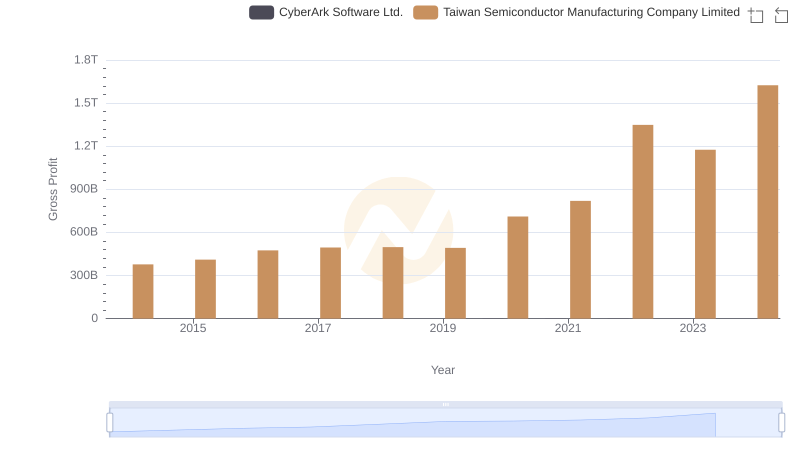
Taiwan Semiconductor Manufacturing Company Limited vs CyberArk Software Ltd.: A Gross Profit Performance Breakdown

Broadcom Inc. and Cognizant Technology Solutions Corporation: A Detailed Gross Profit Analysis
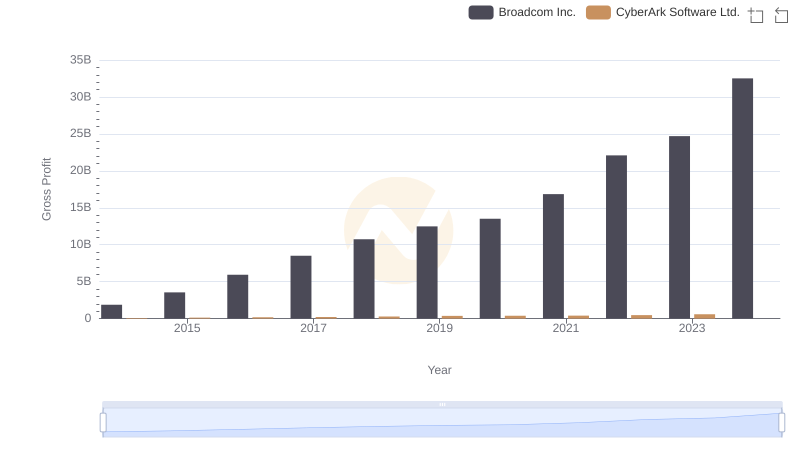
Gross Profit Comparison: Broadcom Inc. and CyberArk Software Ltd. Trends
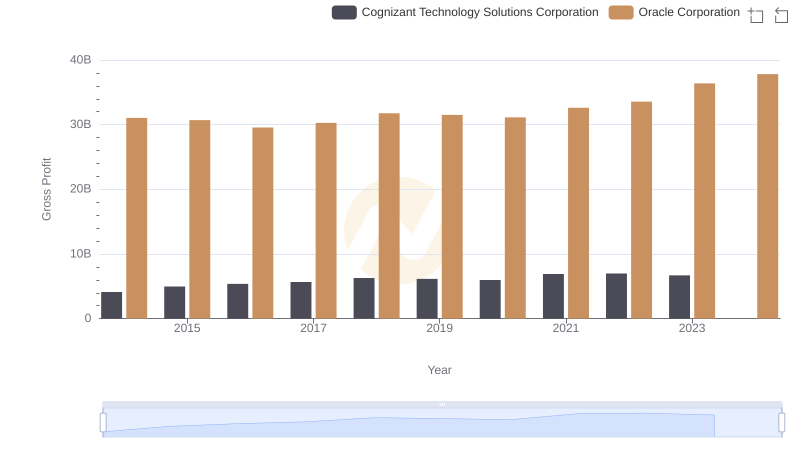
Who Generates Higher Gross Profit? Oracle Corporation or Cognizant Technology Solutions Corporation
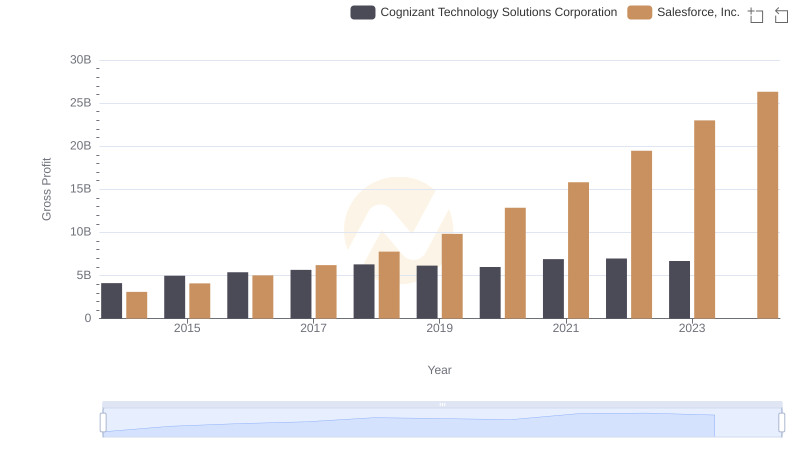
Salesforce, Inc. and Cognizant Technology Solutions Corporation: A Detailed Gross Profit Analysis
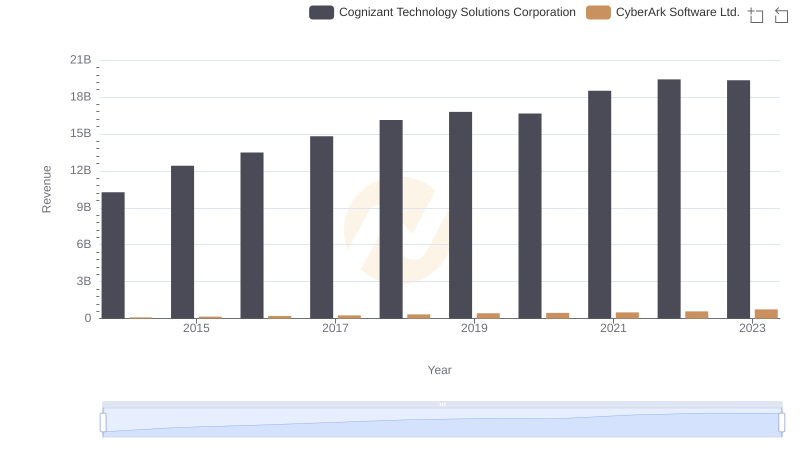
Breaking Down Revenue Trends: Cognizant Technology Solutions Corporation vs CyberArk Software Ltd.
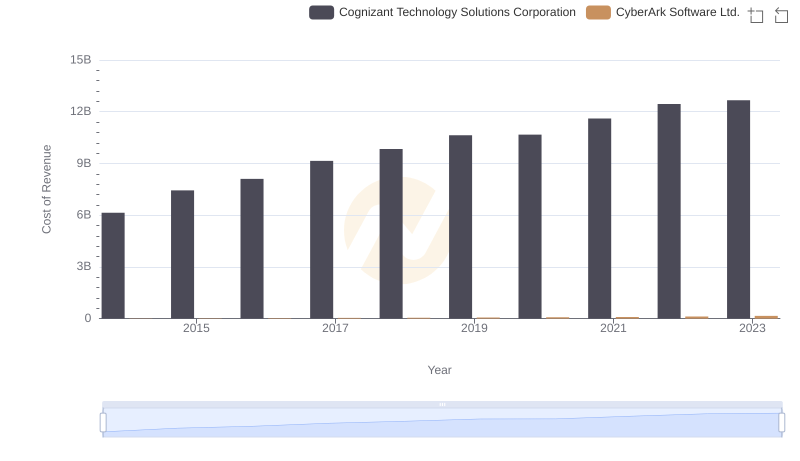
Cost Insights: Breaking Down Cognizant Technology Solutions Corporation and CyberArk Software Ltd.'s Expenses
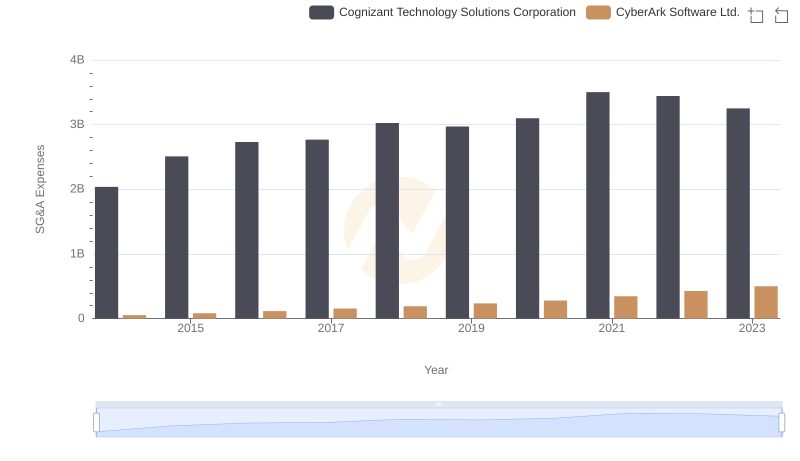
Cost Management Insights: SG&A Expenses for Cognizant Technology Solutions Corporation and CyberArk Software Ltd.