| __timestamp | RTX Corporation | TransUnion |
|---|---|---|
| Wednesday, January 1, 2014 | 17653000000 | 805600000 |
| Thursday, January 1, 2015 | 15667000000 | 975200000 |
| Friday, January 1, 2016 | 15784000000 | 1125800000 |
| Sunday, January 1, 2017 | 15884000000 | 1288100000 |
| Monday, January 1, 2018 | 16516000000 | 1527100000 |
| Tuesday, January 1, 2019 | 19981000000 | 1782000000 |
| Wednesday, January 1, 2020 | 8531000000 | 1796200000 |
| Friday, January 1, 2021 | 12491000000 | 1968600000 |
| Saturday, January 1, 2022 | 13668000000 | 2487000000 |
| Sunday, January 1, 2023 | 12089000000 | 2313900000 |
| Monday, January 1, 2024 | 15410000000 | 4183800000 |
In pursuit of knowledge
Over the past decade, RTX Corporation and TransUnion have showcased contrasting trajectories in their gross profit margins. RTX Corporation, a leader in the aerospace and defense sector, experienced a notable dip in 2020, with profits plummeting by nearly 57% compared to the previous year. However, the company rebounded, achieving a 21% increase by 2022. In contrast, TransUnion, a credit reporting agency, demonstrated consistent growth, with a remarkable 208% increase in gross profit from 2014 to 2022.
While RTX's profits fluctuated, TransUnion's steady climb highlights its resilience in the financial sector. The data for 2024 remains incomplete, but the trends suggest a potential continuation of these patterns. Investors and analysts should consider these historical insights when forecasting future performance.
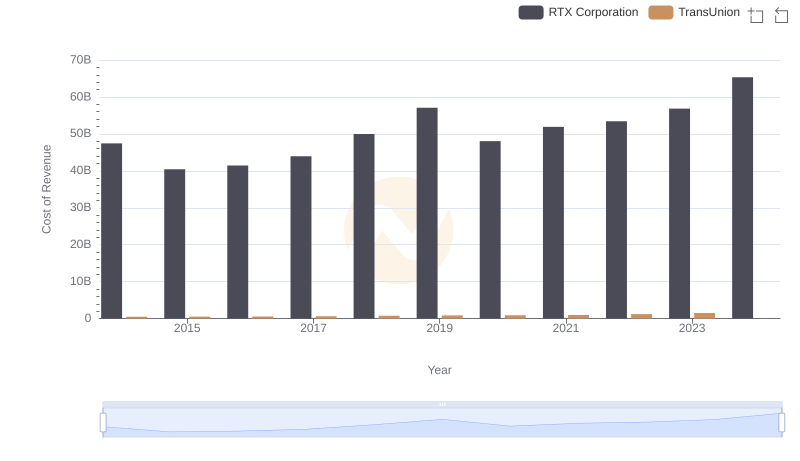
Comparing Cost of Revenue Efficiency: RTX Corporation vs TransUnion

RTX Corporation vs Snap-on Incorporated: A Gross Profit Performance Breakdown

Gross Profit Analysis: Comparing RTX Corporation and Stanley Black & Decker, Inc.
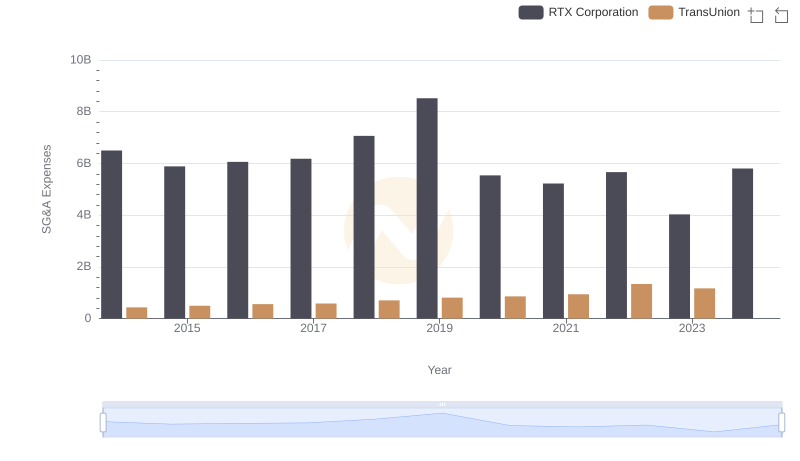
RTX Corporation or TransUnion: Who Manages SG&A Costs Better?
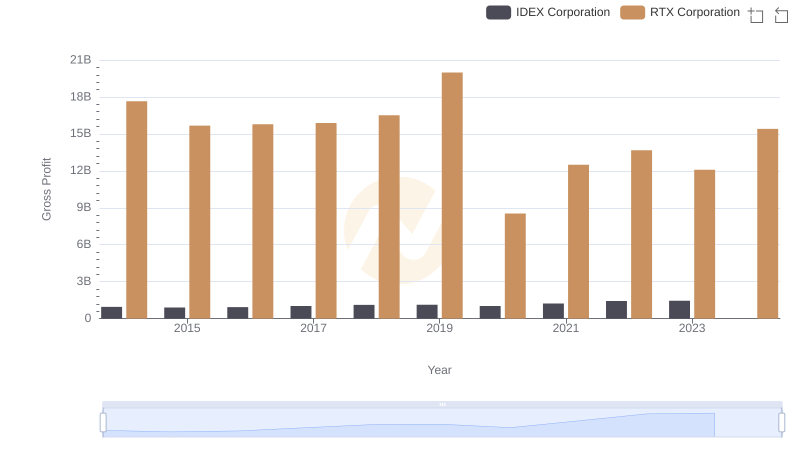
RTX Corporation and IDEX Corporation: A Detailed Gross Profit Analysis