| __timestamp | Comfort Systems USA, Inc. | FedEx Corporation |
|---|---|---|
| Wednesday, January 1, 2014 | 1161024000 | 36194000000 |
| Thursday, January 1, 2015 | 1262390000 | 38895000000 |
| Friday, January 1, 2016 | 1290331000 | 40037000000 |
| Sunday, January 1, 2017 | 1421641000 | 46511000000 |
| Monday, January 1, 2018 | 1736600000 | 50750000000 |
| Tuesday, January 1, 2019 | 2113334000 | 54866000000 |
| Wednesday, January 1, 2020 | 2309676000 | 55873000000 |
| Friday, January 1, 2021 | 2510429000 | 66005000000 |
| Saturday, January 1, 2022 | 3398756000 | 73345000000 |
| Sunday, January 1, 2023 | 4216251000 | 70989000000 |
| Monday, January 1, 2024 | 68741000000 |
Infusing magic into the data realm
In the ever-evolving landscape of corporate efficiency, the cost of revenue serves as a pivotal metric. From 2014 to 2023, FedEx Corporation and Comfort Systems USA, Inc. have showcased distinct trajectories in managing their cost of revenue. FedEx, a global logistics giant, has consistently maintained a higher cost of revenue, peaking at approximately $73 billion in 2022. This reflects its expansive operations and global reach. In contrast, Comfort Systems USA, a leader in mechanical systems installation, has demonstrated a more modest yet steady growth, with its cost of revenue increasing by nearly 263% over the same period. Notably, 2023 saw a slight dip for FedEx, while Comfort Systems USA continued its upward trend. This comparison highlights the diverse strategies and market dynamics influencing these industry leaders. Missing data for 2024 suggests a need for cautious interpretation of future trends.
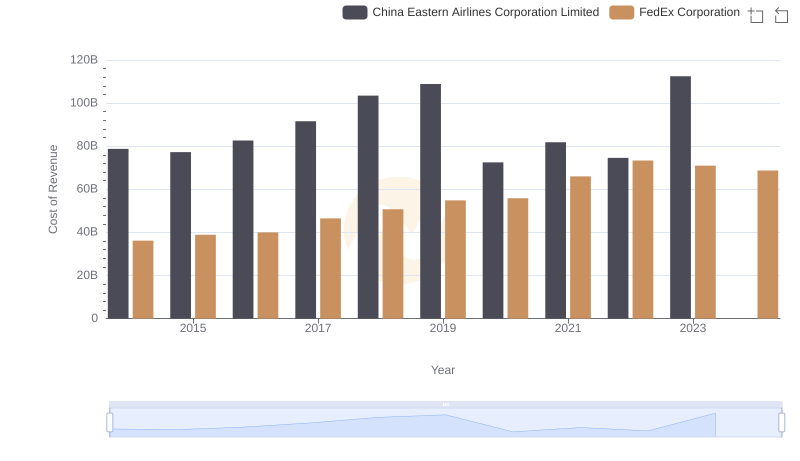
Cost of Revenue: Key Insights for FedEx Corporation and China Eastern Airlines Corporation Limited
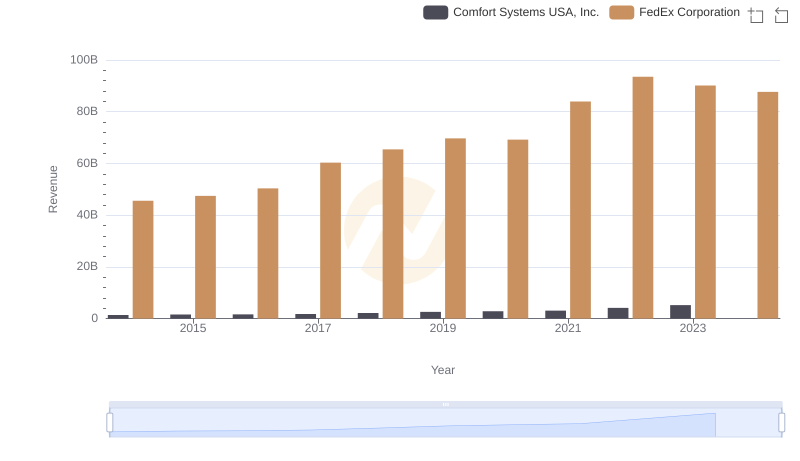
FedEx Corporation vs Comfort Systems USA, Inc.: Examining Key Revenue Metrics
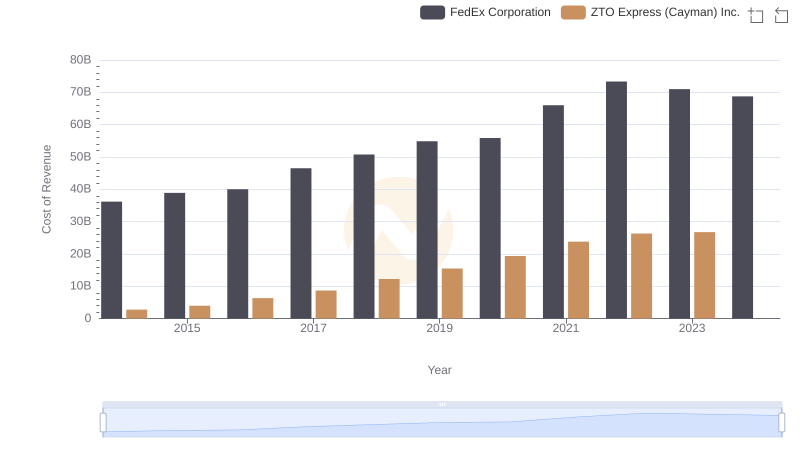
Cost of Revenue Trends: FedEx Corporation vs ZTO Express (Cayman) Inc.
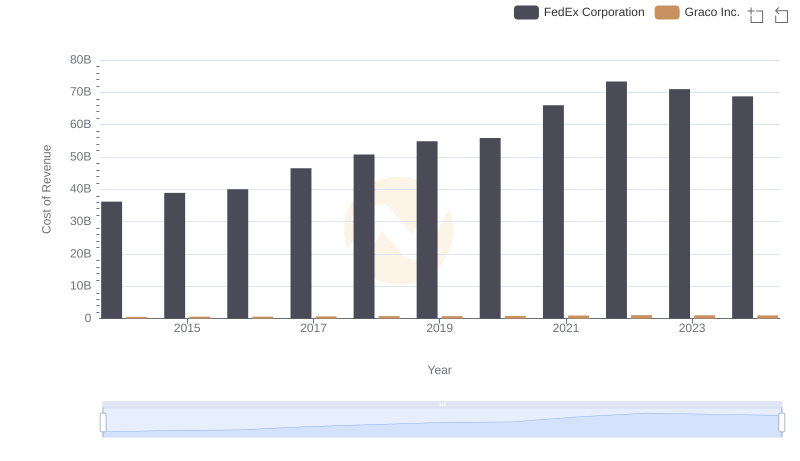
Cost of Revenue: Key Insights for FedEx Corporation and Graco Inc.
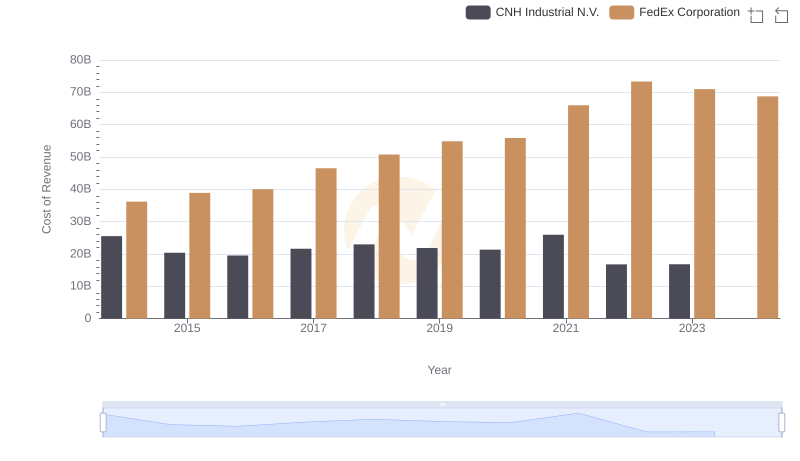
FedEx Corporation vs CNH Industrial N.V.: Efficiency in Cost of Revenue Explored
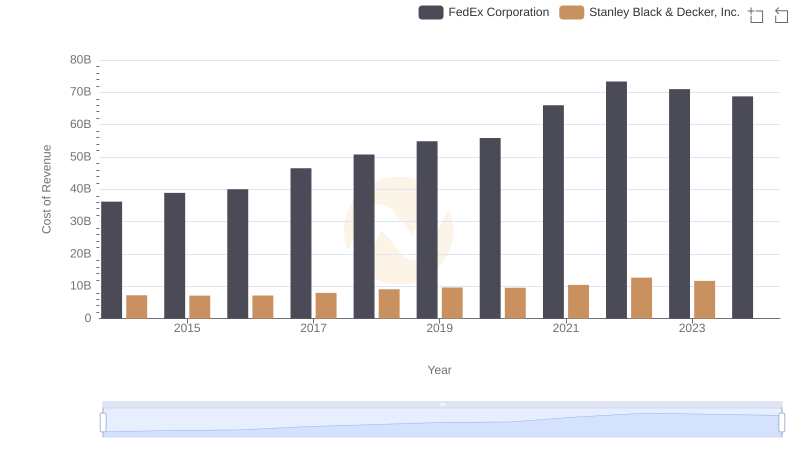
Cost of Revenue Comparison: FedEx Corporation vs Stanley Black & Decker, Inc.
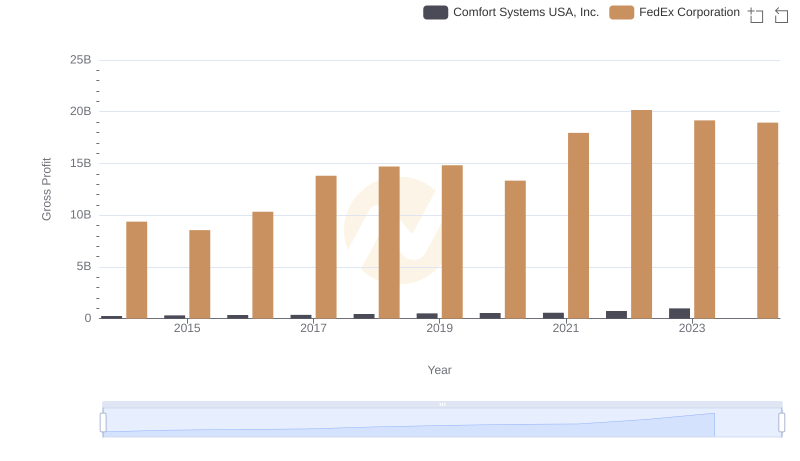
Gross Profit Comparison: FedEx Corporation and Comfort Systems USA, Inc. Trends
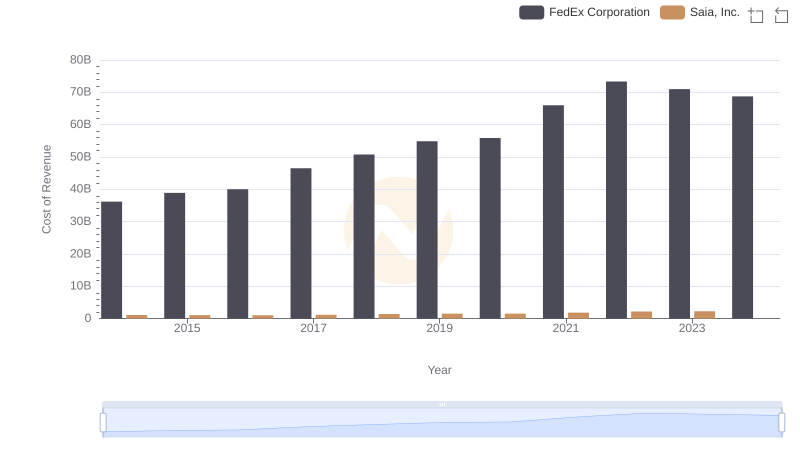
Analyzing Cost of Revenue: FedEx Corporation and Saia, Inc.
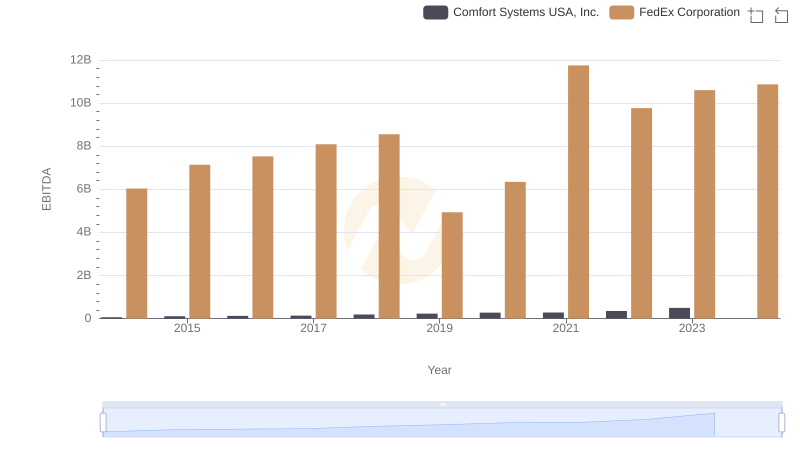
FedEx Corporation and Comfort Systems USA, Inc.: A Detailed Examination of EBITDA Performance