| __timestamp | C.H. Robinson Worldwide, Inc. | U-Haul Holding Company |
|---|---|---|
| Wednesday, January 1, 2014 | 805427000 | 923383000 |
| Thursday, January 1, 2015 | 924719000 | 1076520000 |
| Friday, January 1, 2016 | 912200000 | 1255474000 |
| Sunday, January 1, 2017 | 868096000 | 1195593000 |
| Monday, January 1, 2018 | 1008812000 | 1123974000 |
| Tuesday, January 1, 2019 | 890425000 | 1200955000 |
| Wednesday, January 1, 2020 | 774995000 | 1202436000 |
| Friday, January 1, 2021 | 1173367000 | 1627442000 |
| Saturday, January 1, 2022 | 1359558000 | 2337788000 |
| Sunday, January 1, 2023 | 613592000 | 2183839000 |
| Monday, January 1, 2024 | 766301000 | 1919656000 |
Igniting the spark of knowledge
In the ever-evolving landscape of American business, the financial health of companies is a key indicator of their resilience and growth potential. This analysis focuses on the EBITDA performance of two industry giants: U-Haul Holding Company and C.H. Robinson Worldwide, Inc., from 2014 to 2024.
U-Haul, a leader in the moving and storage sector, has shown a remarkable upward trajectory, with its EBITDA growing by approximately 133% over the decade. In contrast, C.H. Robinson, a major player in logistics, experienced a more volatile journey, with a peak in 2022 followed by a significant drop in 2023. This decline represents a 55% decrease from its 2022 high.
The data reveals U-Haul's consistent growth, particularly in the last three years, where it outperformed C.H. Robinson by a substantial margin. This trend underscores U-Haul's strategic positioning and adaptability in a competitive market.
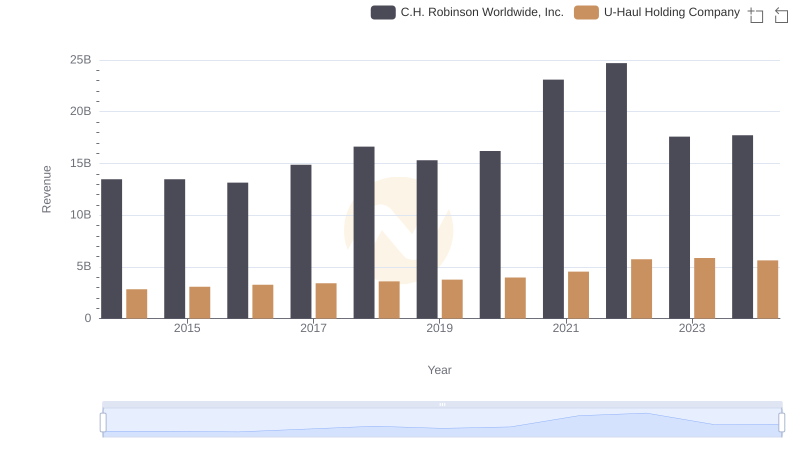
Revenue Showdown: U-Haul Holding Company vs C.H. Robinson Worldwide, Inc.
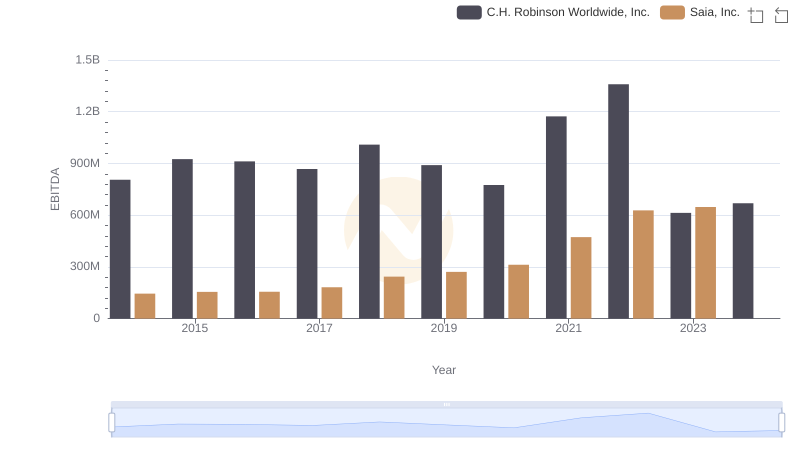
EBITDA Performance Review: Saia, Inc. vs C.H. Robinson Worldwide, Inc.
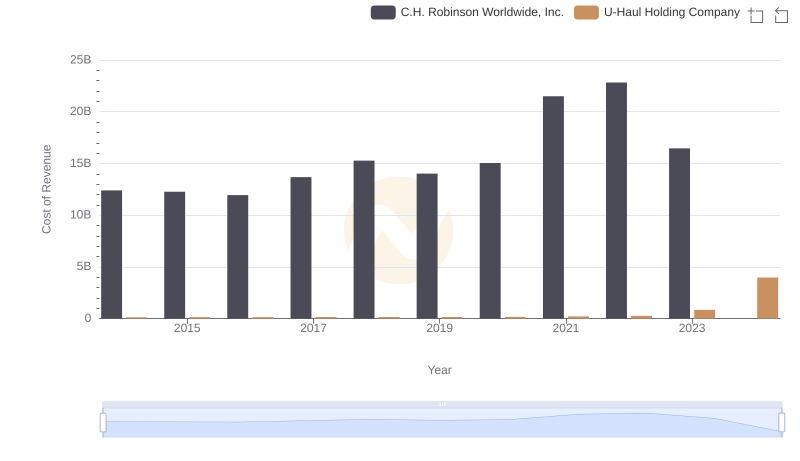
Cost of Revenue Comparison: U-Haul Holding Company vs C.H. Robinson Worldwide, Inc.
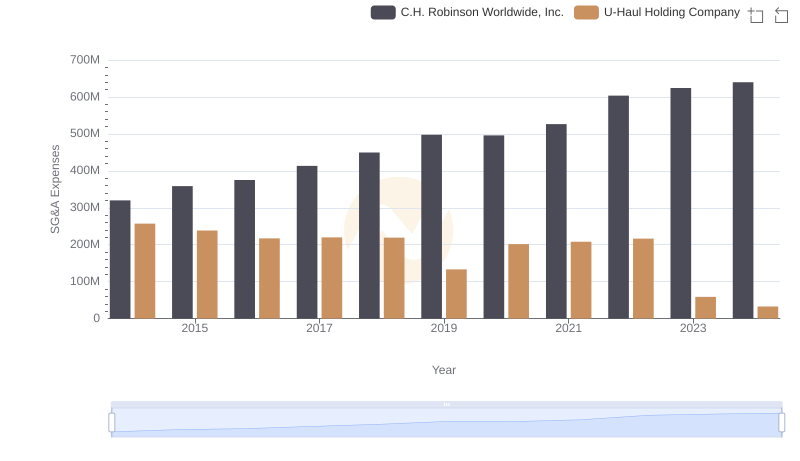
U-Haul Holding Company vs C.H. Robinson Worldwide, Inc.: SG&A Expense Trends
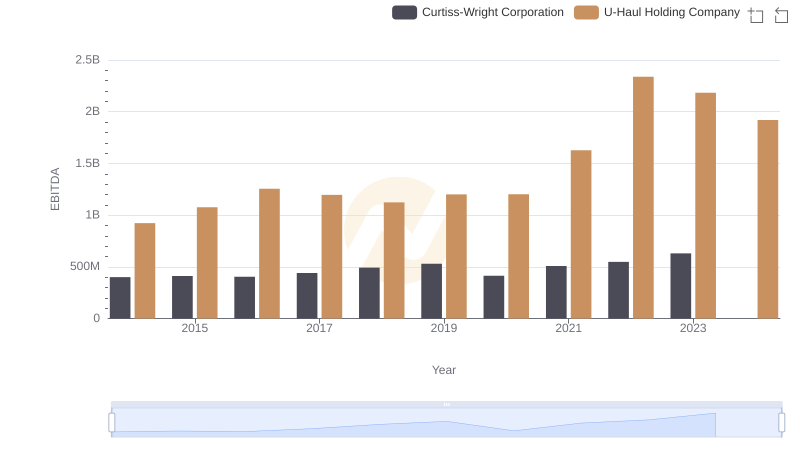
A Side-by-Side Analysis of EBITDA: U-Haul Holding Company and Curtiss-Wright Corporation
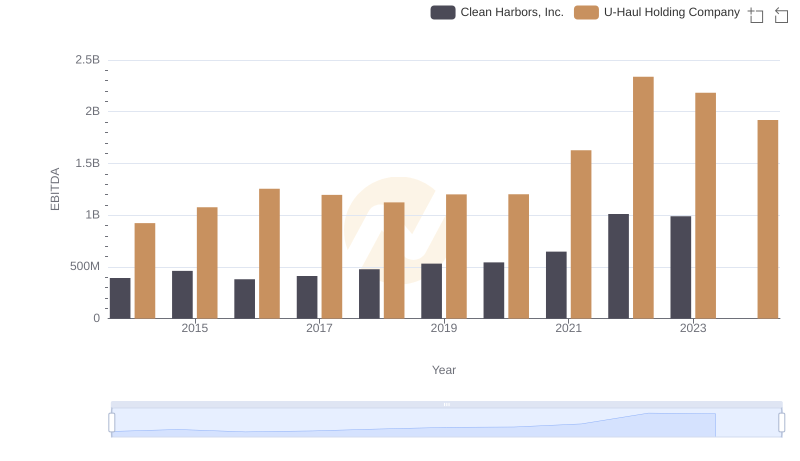
U-Haul Holding Company and Clean Harbors, Inc.: A Detailed Examination of EBITDA Performance
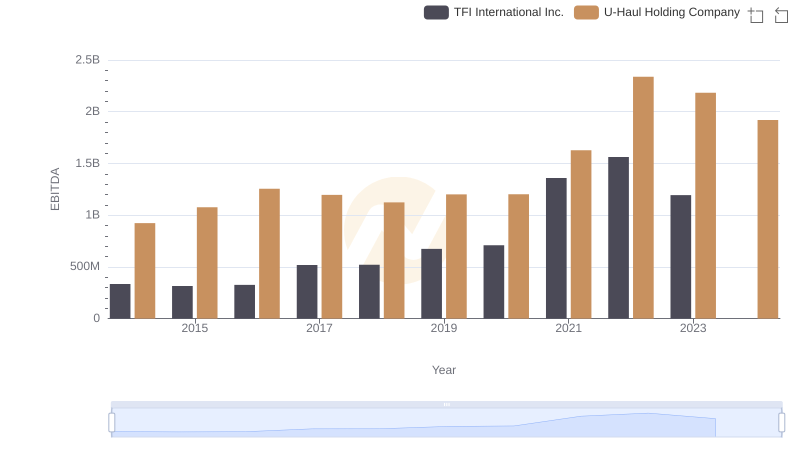
EBITDA Metrics Evaluated: U-Haul Holding Company vs TFI International Inc.