| __timestamp | Infosys Limited | SAP SE |
|---|---|---|
| Wednesday, January 1, 2014 | 2258000000 | 5775000000 |
| Thursday, January 1, 2015 | 2590000000 | 6163000000 |
| Friday, January 1, 2016 | 2765000000 | 6429000000 |
| Sunday, January 1, 2017 | 2936000000 | 6331000000 |
| Monday, January 1, 2018 | 2984000000 | 7084000000 |
| Tuesday, January 1, 2019 | 3053000000 | 7474000000 |
| Wednesday, January 1, 2020 | 4053342784 | 8258000000 |
| Friday, January 1, 2021 | 4116000000 | 8917000000 |
| Saturday, January 1, 2022 | 4707334610 | 6480000000 |
| Sunday, January 1, 2023 | 4206000000 | 7502000000 |
| Monday, January 1, 2024 | 7075000000 |
Unleashing insights
In the ever-evolving landscape of global technology giants, SAP SE and Infosys Limited have consistently demonstrated robust financial performance. From 2014 to 2023, SAP SE's EBITDA has shown a steady upward trajectory, peaking in 2020 with an impressive 43% increase from 2014. Meanwhile, Infosys Limited has also experienced significant growth, with its EBITDA nearly doubling over the same period.
SAP SE, headquartered in Germany, has maintained a stronghold in the enterprise software market, while Infosys, based in India, has expanded its global footprint in IT services. The data reveals that SAP SE's EBITDA consistently outpaces Infosys, with a 2023 EBITDA approximately 78% higher than that of Infosys. However, Infosys's growth rate is noteworthy, reflecting its strategic expansions and innovations.
This analysis underscores the dynamic nature of the tech industry, where strategic decisions and market adaptability are key to sustained financial success.
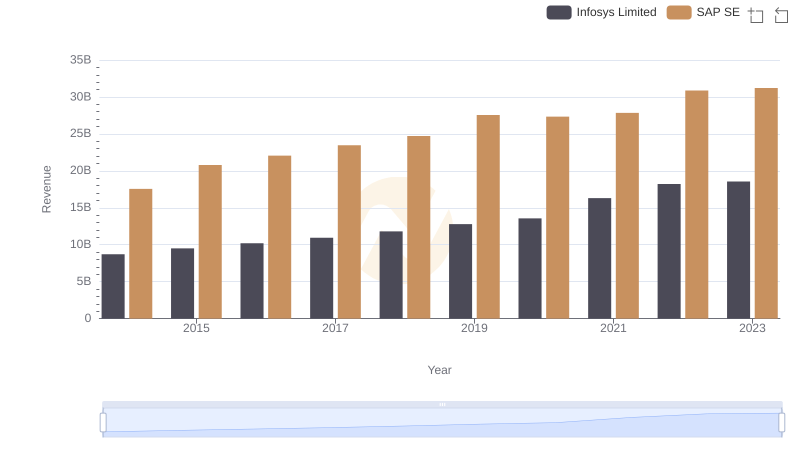
Comparing Revenue Performance: SAP SE or Infosys Limited?
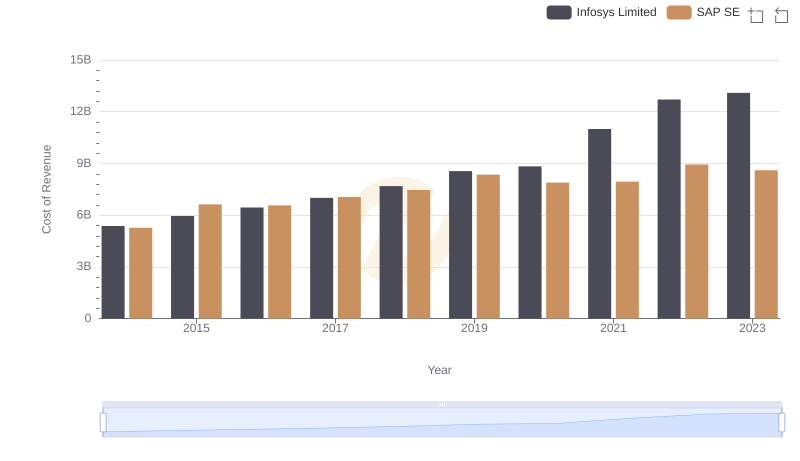
Cost of Revenue Trends: SAP SE vs Infosys Limited
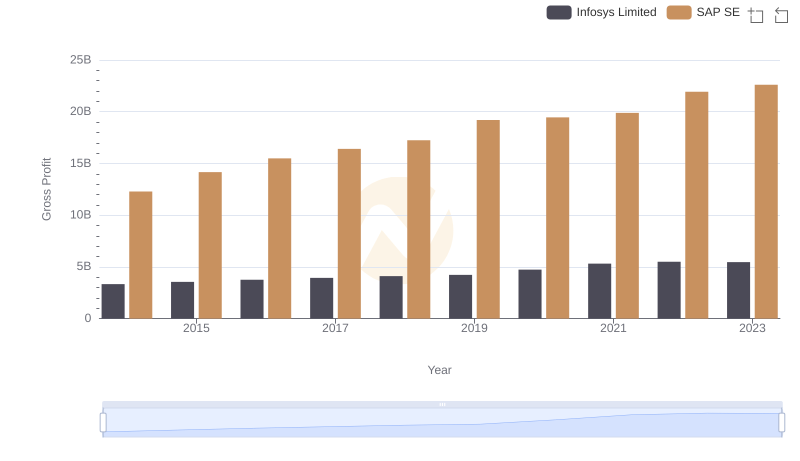
SAP SE vs Infosys Limited: A Gross Profit Performance Breakdown
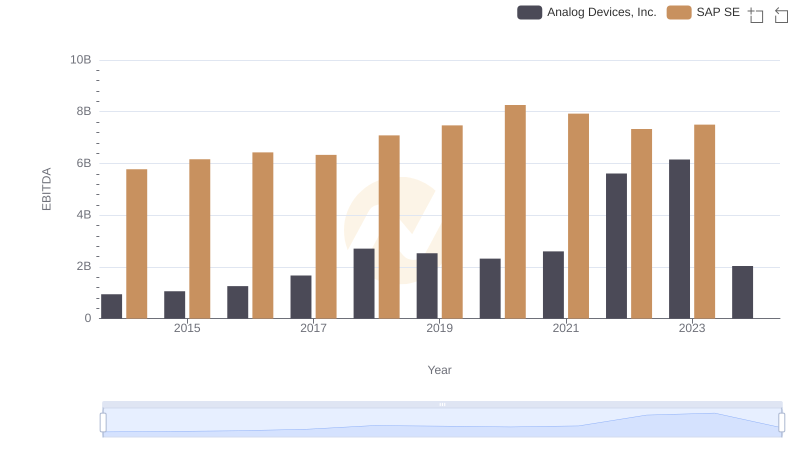
Comprehensive EBITDA Comparison: SAP SE vs Analog Devices, Inc.
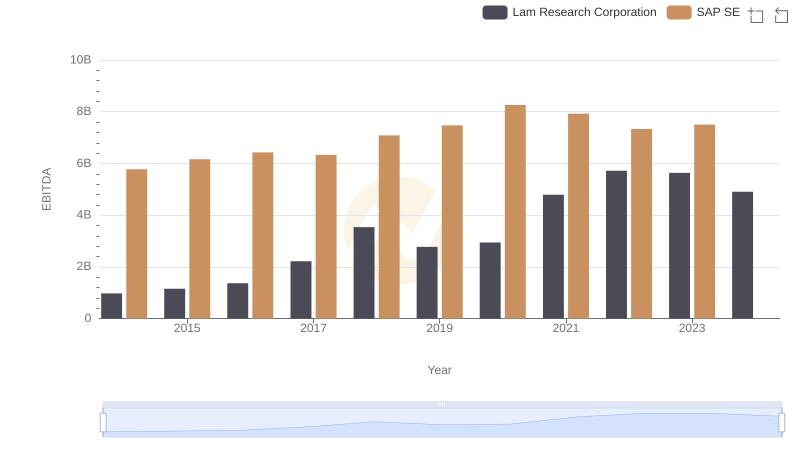
SAP SE and Lam Research Corporation: A Detailed Examination of EBITDA Performance
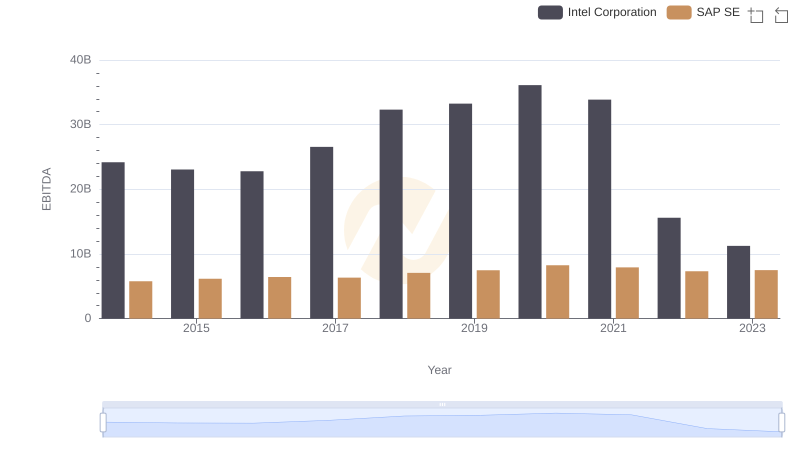
Comparative EBITDA Analysis: SAP SE vs Intel Corporation
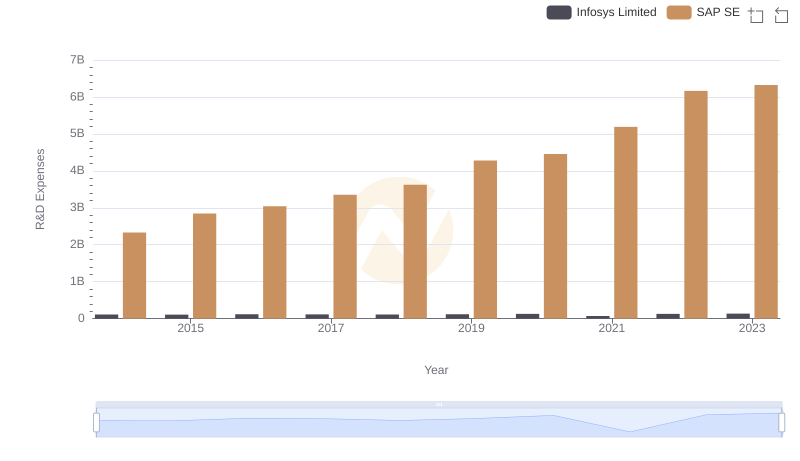
Research and Development: Comparing Key Metrics for SAP SE and Infosys Limited
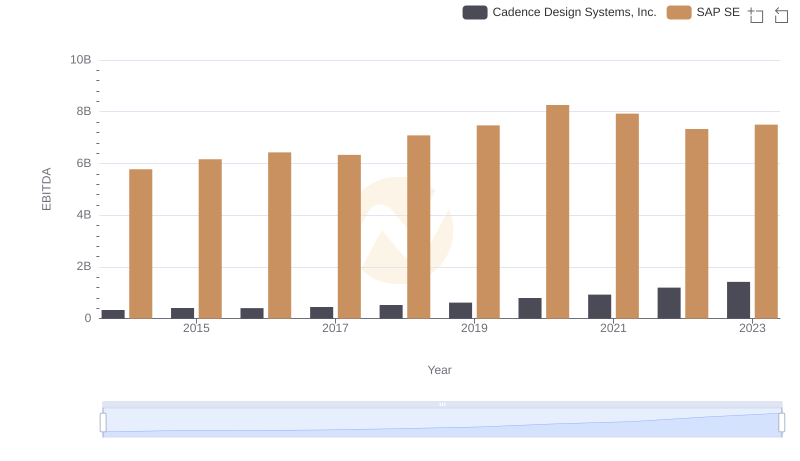
Comprehensive EBITDA Comparison: SAP SE vs Cadence Design Systems, Inc.
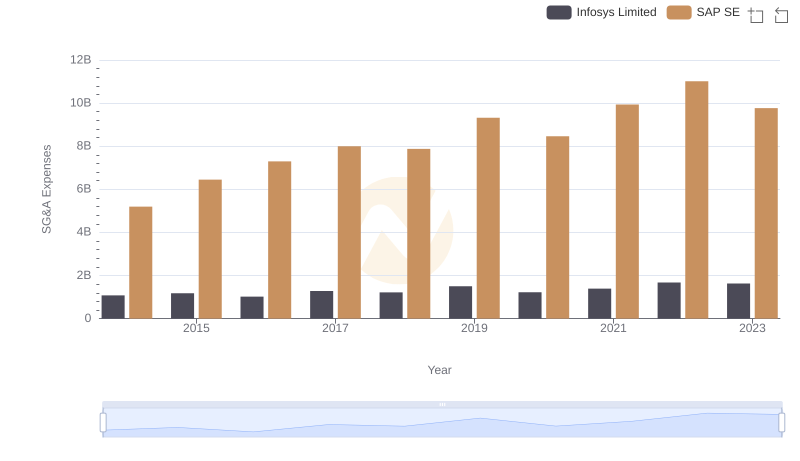
SAP SE or Infosys Limited: Who Manages SG&A Costs Better?
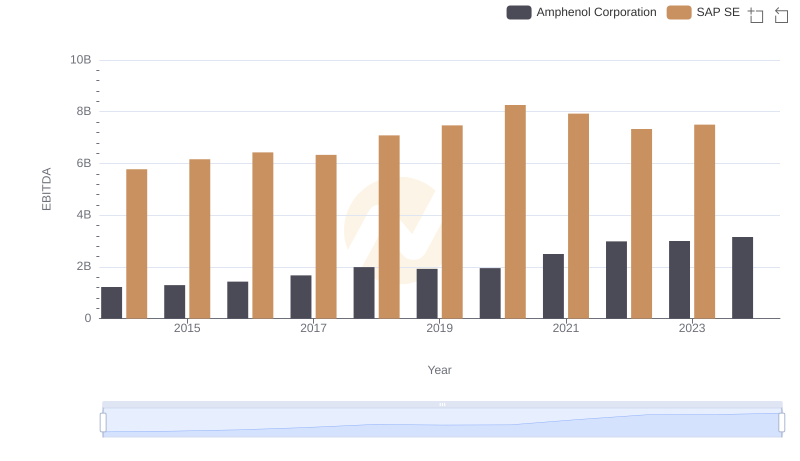
A Professional Review of EBITDA: SAP SE Compared to Amphenol Corporation
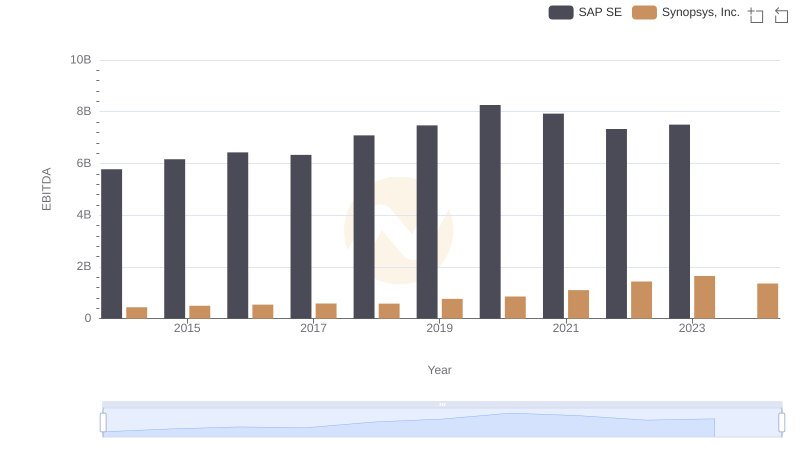
SAP SE vs Synopsys, Inc.: In-Depth EBITDA Performance Comparison
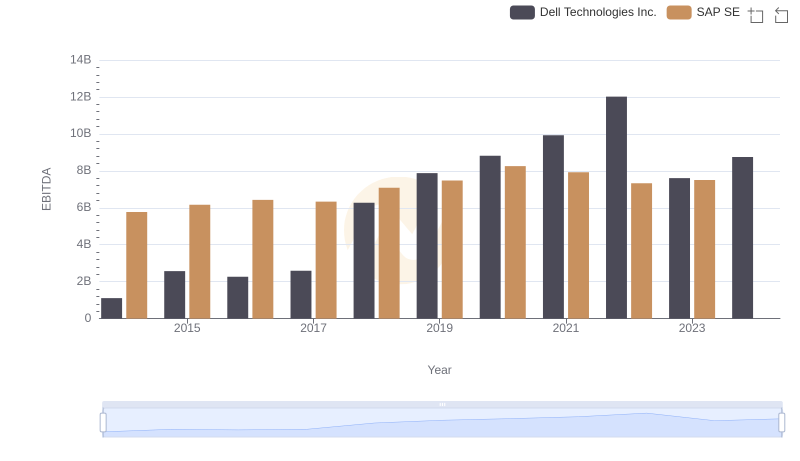
A Side-by-Side Analysis of EBITDA: SAP SE and Dell Technologies Inc.