| __timestamp | Deere & Company | Roper Technologies, Inc. |
|---|---|---|
| Wednesday, January 1, 2014 | 24775800000 | 1447595000 |
| Thursday, January 1, 2015 | 20143200000 | 1417749000 |
| Friday, January 1, 2016 | 18248900000 | 1457515000 |
| Sunday, January 1, 2017 | 19933500000 | 1742675000 |
| Monday, January 1, 2018 | 25571200000 | 1911700000 |
| Tuesday, January 1, 2019 | 26792000000 | 1939700000 |
| Wednesday, January 1, 2020 | 23677000000 | 1984100000 |
| Friday, January 1, 2021 | 29116000000 | 1860400000 |
| Saturday, January 1, 2022 | 35338000000 | 1619000000 |
| Sunday, January 1, 2023 | 40105000000 | 1870600000 |
| Monday, January 1, 2024 | 30775000000 | 2160900000 |
Unlocking the unknown
In the ever-evolving landscape of industrial giants, understanding cost efficiency is crucial. Deere & Company, a leader in agricultural machinery, and Roper Technologies, Inc., a diversified technology company, present a fascinating study in contrasts. From 2014 to 2023, Deere & Company consistently reported a higher cost of revenue, peaking at approximately $40 billion in 2023, a 62% increase from 2014. In contrast, Roper Technologies maintained a more stable cost of revenue, averaging around $1.7 billion annually, with a slight uptick in 2020.
This disparity highlights Deere's expansive operations and market reach, while Roper's steady figures suggest a focus on efficiency and niche markets. The data for 2024 is incomplete, indicating potential shifts in strategy or market conditions. As these companies navigate the future, their cost management strategies will be pivotal in maintaining competitive advantage.
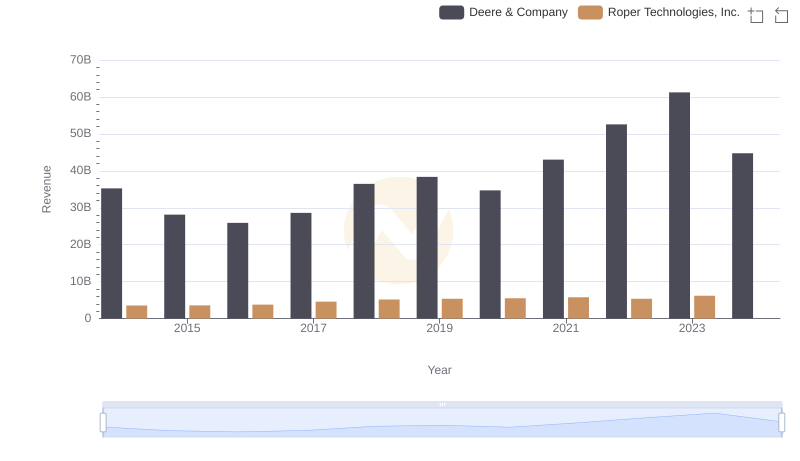
Revenue Insights: Deere & Company and Roper Technologies, Inc. Performance Compared

Cost Insights: Breaking Down Deere & Company and Norfolk Southern Corporation's Expenses
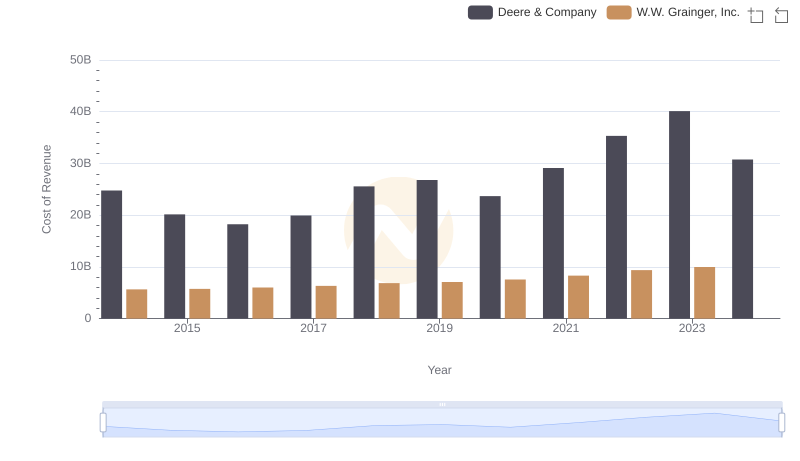
Cost of Revenue Comparison: Deere & Company vs W.W. Grainger, Inc.
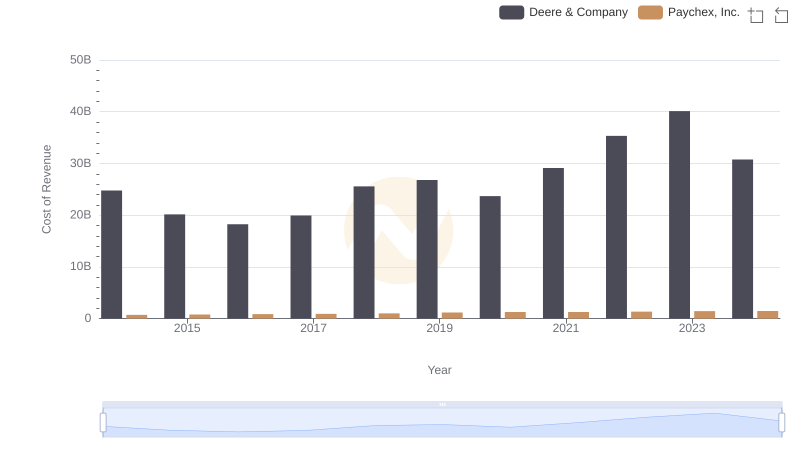
Cost Insights: Breaking Down Deere & Company and Paychex, Inc.'s Expenses
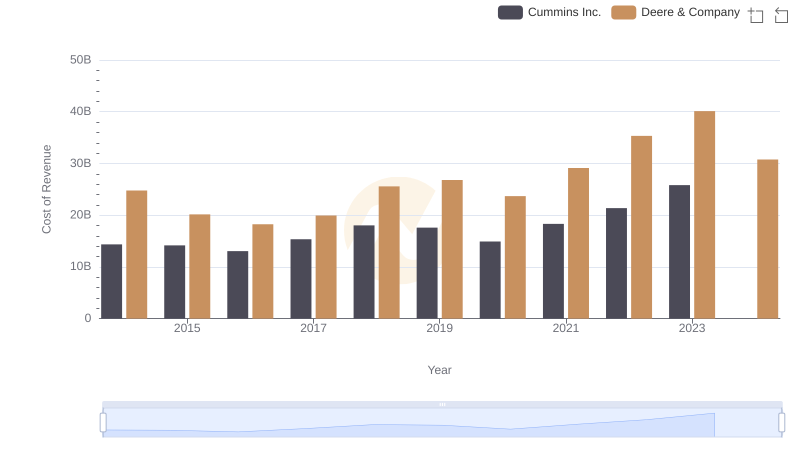
Analyzing Cost of Revenue: Deere & Company and Cummins Inc.
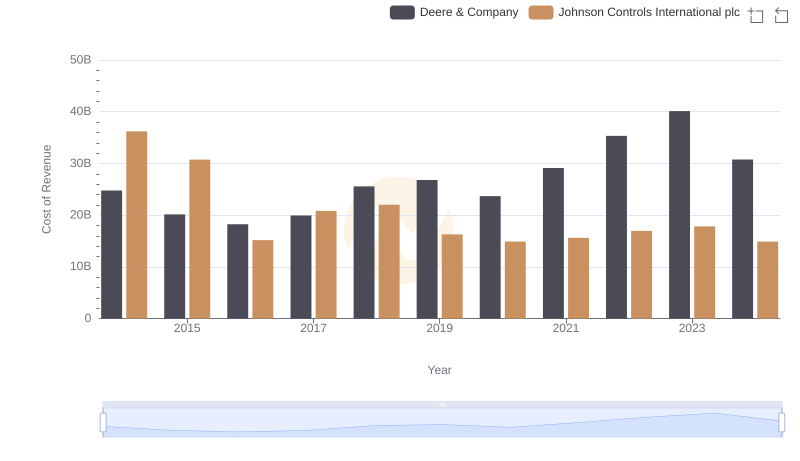
Cost of Revenue Trends: Deere & Company vs Johnson Controls International plc
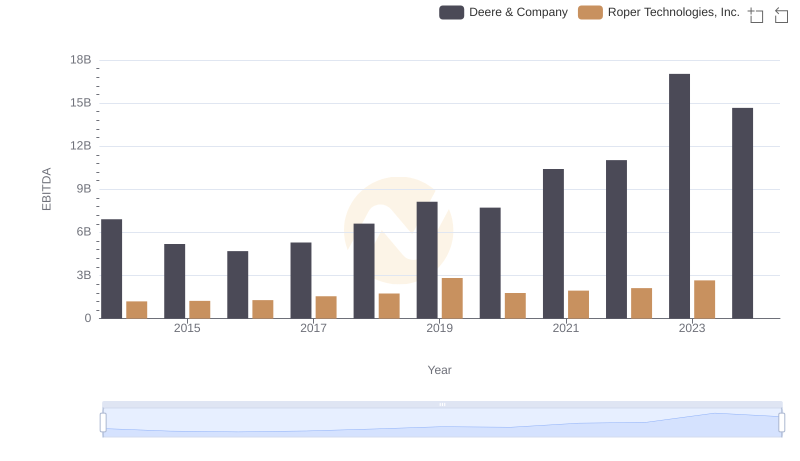
Comprehensive EBITDA Comparison: Deere & Company vs Roper Technologies, Inc.