| __timestamp | Comfort Systems USA, Inc. | Deere & Company |
|---|---|---|
| Wednesday, January 1, 2014 | 1410795000 | 35242700000 |
| Thursday, January 1, 2015 | 1580519000 | 28156300000 |
| Friday, January 1, 2016 | 1634340000 | 25898500000 |
| Sunday, January 1, 2017 | 1787922000 | 28616600000 |
| Monday, January 1, 2018 | 2182879000 | 36457300000 |
| Tuesday, January 1, 2019 | 2615277000 | 38379000000 |
| Wednesday, January 1, 2020 | 2856659000 | 34722000000 |
| Friday, January 1, 2021 | 3073636000 | 43033000000 |
| Saturday, January 1, 2022 | 4140364000 | 52577000000 |
| Sunday, January 1, 2023 | 5206760000 | 61222000000 |
| Monday, January 1, 2024 | 44759000000 |
Infusing magic into the data realm
In the ever-evolving landscape of American industry, two companies stand out for their remarkable revenue growth over the past decade. Deere & Company, a titan in the agricultural machinery sector, and Comfort Systems USA, Inc., a leader in mechanical contracting, have both demonstrated impressive financial trajectories from 2014 to 2023.
Deere & Company, with its roots dating back to 1837, has seen its annual revenue grow by approximately 74% over this period, peaking at $61.2 billion in 2023. Meanwhile, Comfort Systems USA, Inc., founded in 1997, has experienced a staggering 269% increase, reaching $5.2 billion in the same year.
This comparison highlights the diverse growth strategies of these companies, with Deere & Company capitalizing on global agricultural demands and Comfort Systems USA, Inc. expanding its footprint in the U.S. construction market. Notably, data for 2024 is incomplete, leaving room for speculation on future trends.
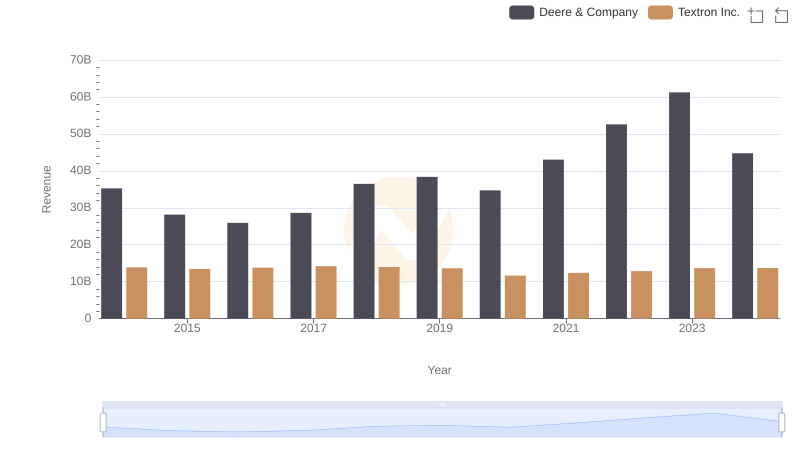
Deere & Company vs Textron Inc.: Annual Revenue Growth Compared
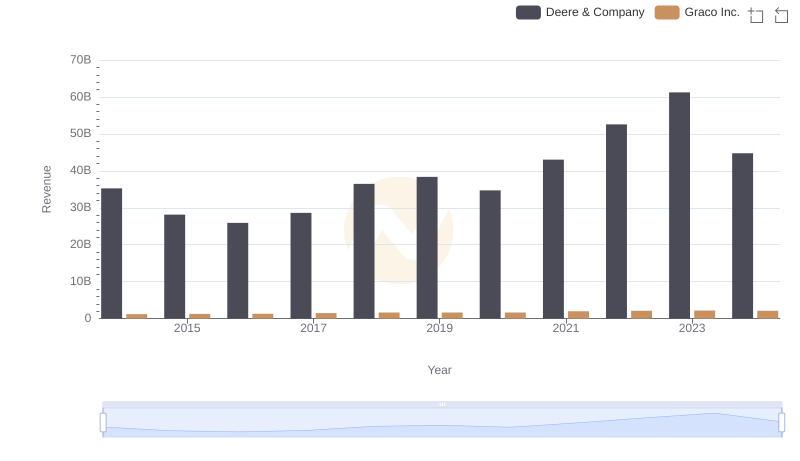
Breaking Down Revenue Trends: Deere & Company vs Graco Inc.
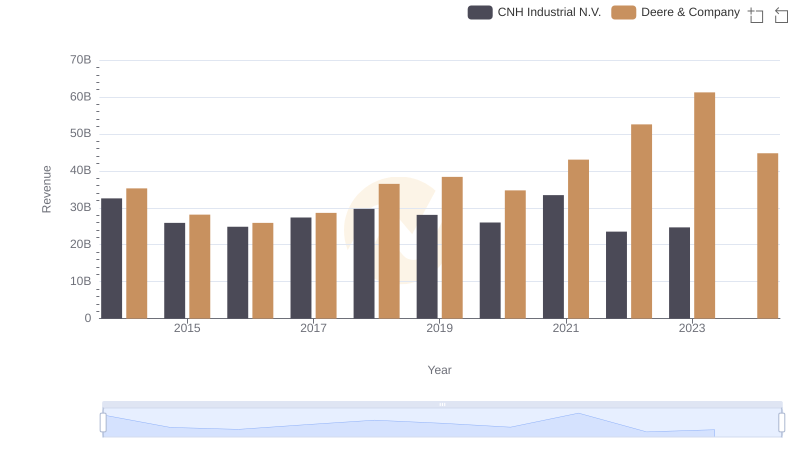
Revenue Insights: Deere & Company and CNH Industrial N.V. Performance Compared
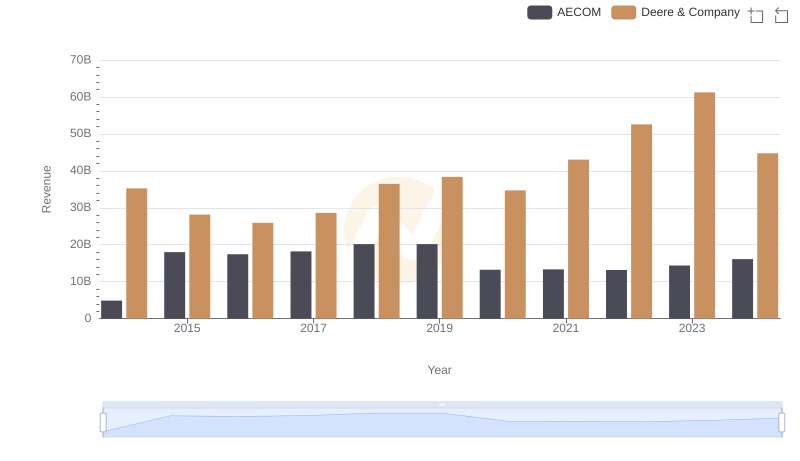
Revenue Showdown: Deere & Company vs AECOM
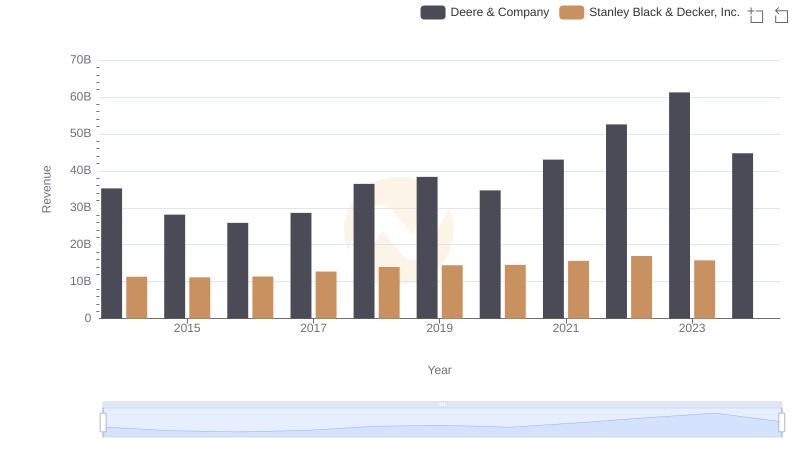
Comparing Revenue Performance: Deere & Company or Stanley Black & Decker, Inc.?
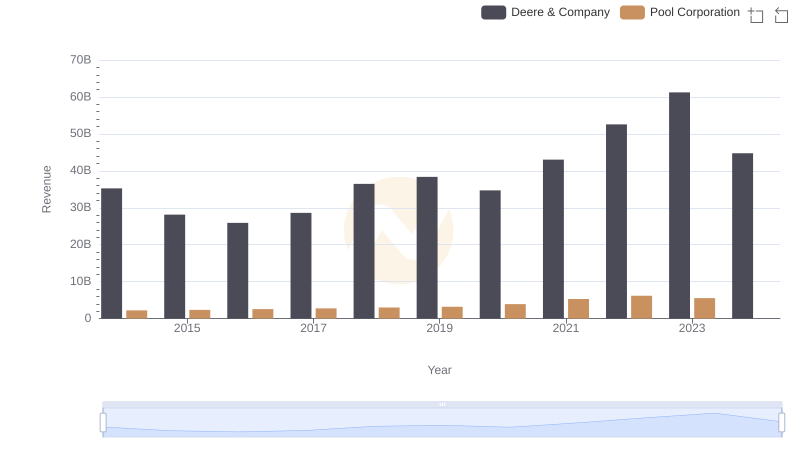
Breaking Down Revenue Trends: Deere & Company vs Pool Corporation
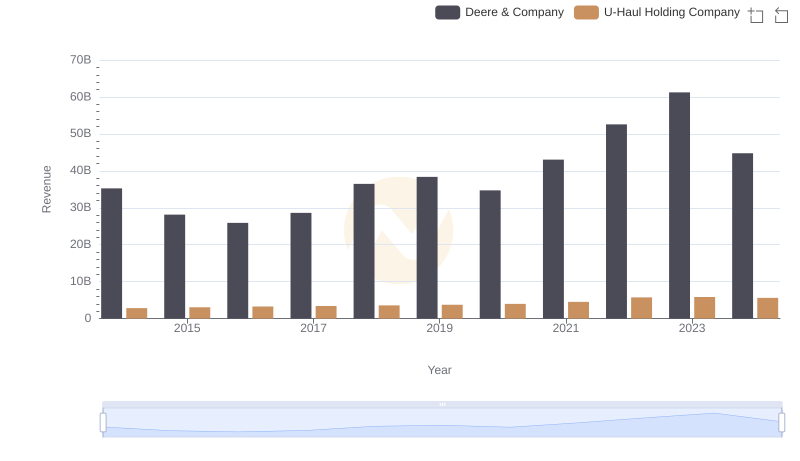
Deere & Company and U-Haul Holding Company: A Comprehensive Revenue Analysis
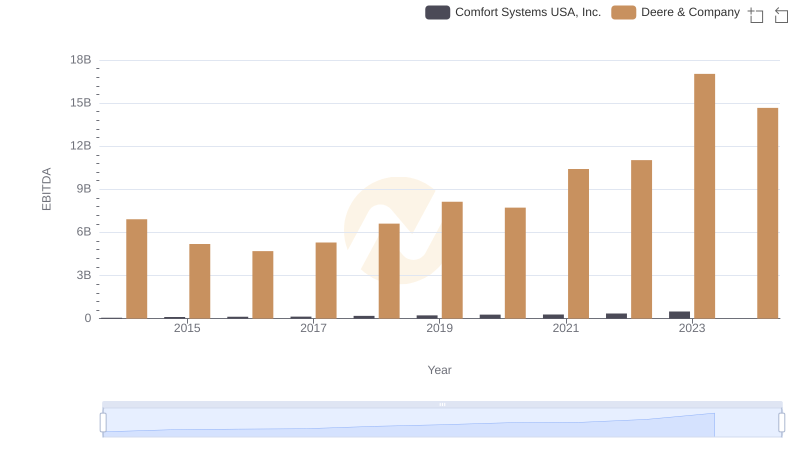
A Side-by-Side Analysis of EBITDA: Deere & Company and Comfort Systems USA, Inc.