| __timestamp | HEICO Corporation | United Parcel Service, Inc. |
|---|---|---|
| Wednesday, January 1, 2014 | 733999000 | 32045000000 |
| Thursday, January 1, 2015 | 754469000 | 31028000000 |
| Friday, January 1, 2016 | 860766000 | 55439000000 |
| Sunday, January 1, 2017 | 950088000 | 58343000000 |
| Monday, January 1, 2018 | 1087006000 | 64837000000 |
| Tuesday, January 1, 2019 | 1241807000 | 66296000000 |
| Wednesday, January 1, 2020 | 1104882000 | 76814000000 |
| Friday, January 1, 2021 | 1138259000 | 84477000000 |
| Saturday, January 1, 2022 | 1345563000 | 87244000000 |
| Sunday, January 1, 2023 | 1814617000 | 73727000000 |
| Monday, January 1, 2024 | 2355943000 | 66048000000 |
Unleashing insights
In the ever-evolving landscape of logistics and aerospace, understanding cost dynamics is crucial. From 2014 to 2023, United Parcel Service, Inc. (UPS) and HEICO Corporation have shown distinct trends in their cost of revenue. UPS, a titan in the logistics industry, saw its cost of revenue grow by approximately 130% from 2014 to 2022, peaking in 2022 before a slight dip in 2023. This reflects the company's strategic investments and operational expansions. Meanwhile, HEICO Corporation, a key player in aerospace, experienced a more than 220% increase over the same period, highlighting its aggressive growth strategy and market adaptation. Notably, 2024 data for UPS is missing, indicating potential reporting delays or strategic shifts. These trends underscore the dynamic nature of these industries and the importance of cost management in maintaining competitive advantage.

Comparing Cost of Revenue Efficiency: United Parcel Service, Inc. vs United Airlines Holdings, Inc.
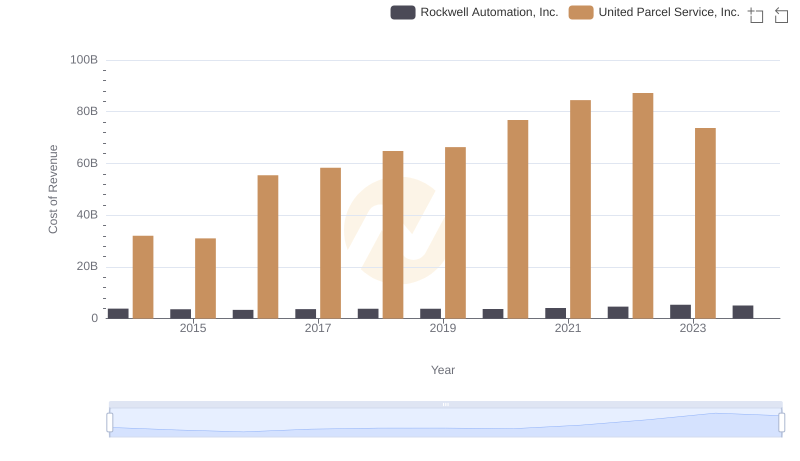
Cost of Revenue Trends: United Parcel Service, Inc. vs Rockwell Automation, Inc.
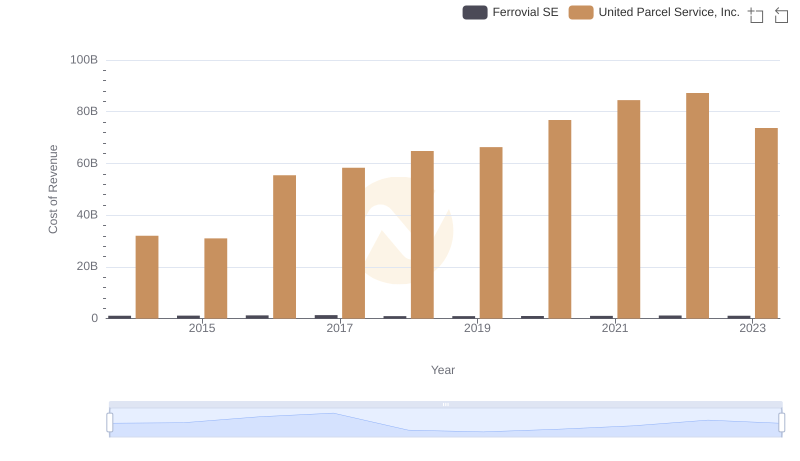
Cost of Revenue: Key Insights for United Parcel Service, Inc. and Ferrovial SE
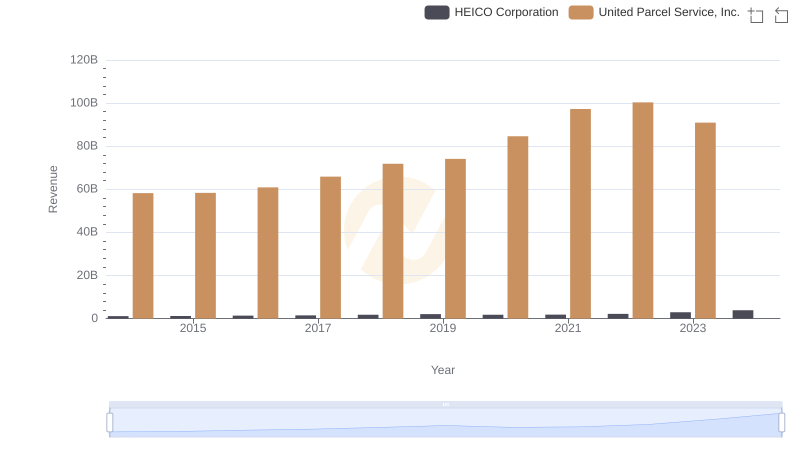
United Parcel Service, Inc. vs HEICO Corporation: Annual Revenue Growth Compared

Analyzing Cost of Revenue: United Parcel Service, Inc. and Equifax Inc.
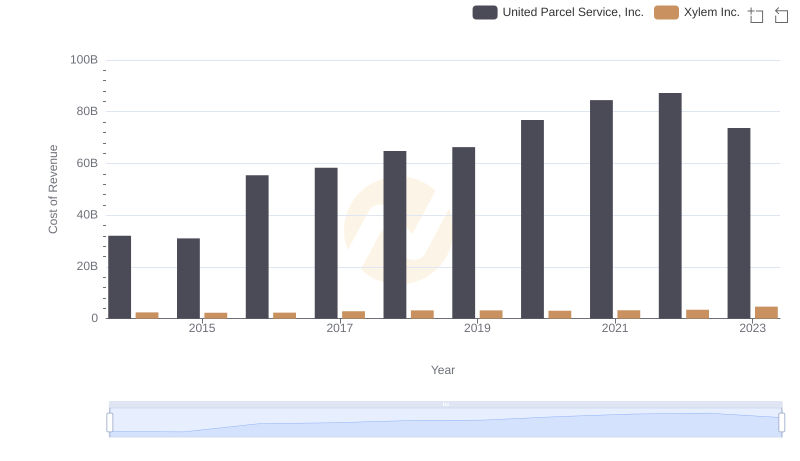
Comparing Cost of Revenue Efficiency: United Parcel Service, Inc. vs Xylem Inc.
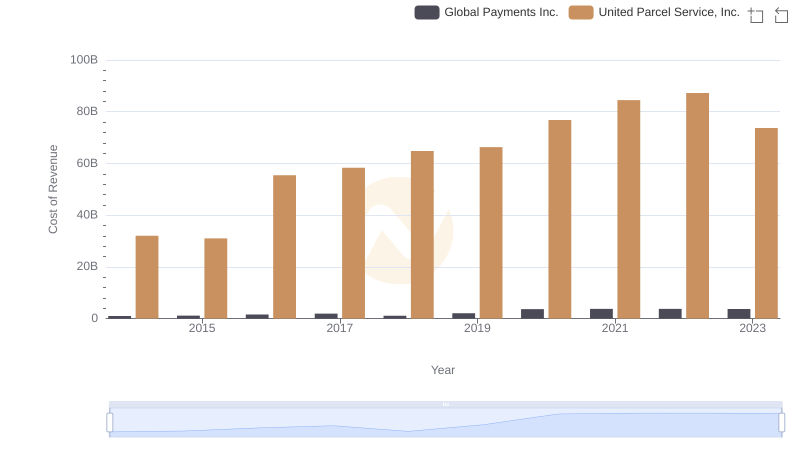
Comparing Cost of Revenue Efficiency: United Parcel Service, Inc. vs Global Payments Inc.
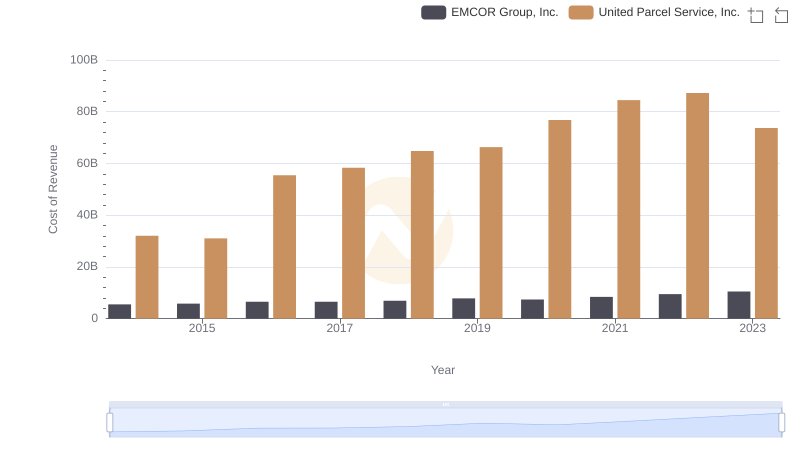
Analyzing Cost of Revenue: United Parcel Service, Inc. and EMCOR Group, Inc.
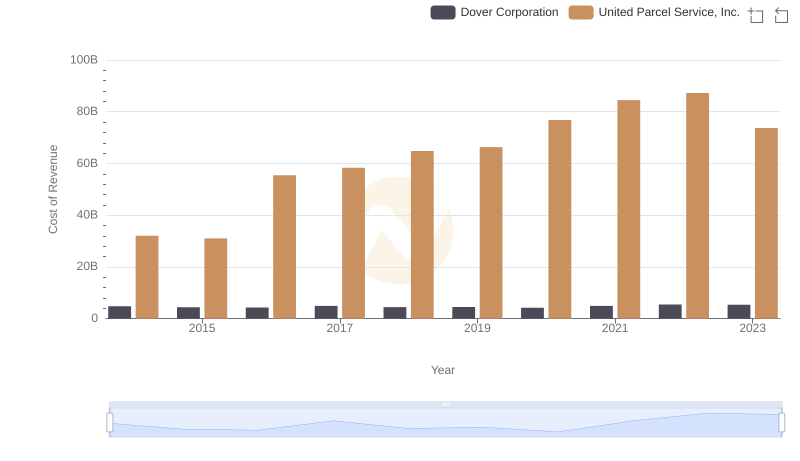
Cost of Revenue Comparison: United Parcel Service, Inc. vs Dover Corporation

Cost of Revenue Comparison: United Parcel Service, Inc. vs Southwest Airlines Co.
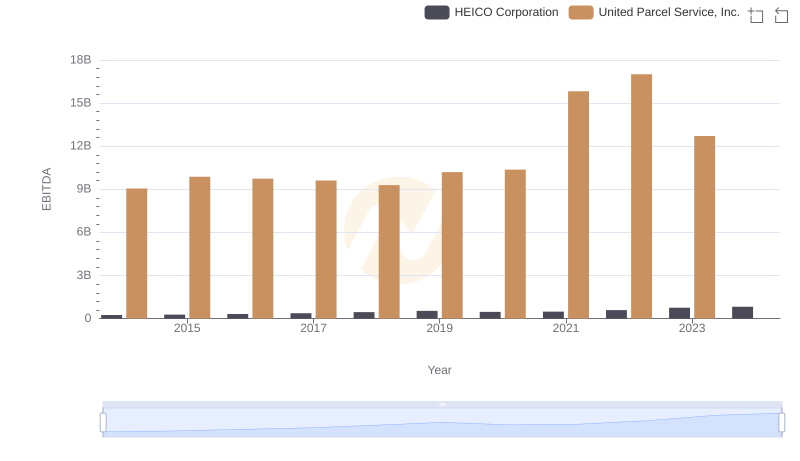
Comparative EBITDA Analysis: United Parcel Service, Inc. vs HEICO Corporation