| __timestamp | Manhattan Associates, Inc. | Shopify Inc. |
|---|---|---|
| Wednesday, January 1, 2014 | 212578000 | 43223000 |
| Thursday, January 1, 2015 | 235428000 | 94162000 |
| Friday, January 1, 2016 | 249879000 | 179835000 |
| Sunday, January 1, 2017 | 245733000 | 293051000 |
| Monday, January 1, 2018 | 240881000 | 476962000 |
| Tuesday, January 1, 2019 | 284967000 | 712530000 |
| Wednesday, January 1, 2020 | 269887000 | 1387971000 |
| Friday, January 1, 2021 | 297827000 | 2130712000 |
| Saturday, January 1, 2022 | 358237000 | 2845745000 |
| Sunday, January 1, 2023 | 430614000 | 3545000000 |
| Monday, January 1, 2024 | 470980000 | 4408000000 |
Unleashing insights
In the ever-evolving landscape of e-commerce and supply chain solutions, Shopify Inc. and Manhattan Associates, Inc. have emerged as key players. Over the past decade, these companies have shown distinct trajectories in their cost of revenue, reflecting their unique business models and market strategies.
Since 2014, Shopify's cost of revenue has skyrocketed, increasing by an astounding 8,100% by 2023. This growth mirrors Shopify's aggressive expansion and its commitment to scaling its platform to support a burgeoning number of merchants worldwide.
Conversely, Manhattan Associates has maintained a more stable cost of revenue, with a modest increase of around 102% over the same period. This stability underscores its strategic focus on optimizing supply chain solutions and maintaining operational efficiency.
It's worth noting that data for 2024 is incomplete, highlighting the dynamic nature of financial reporting.
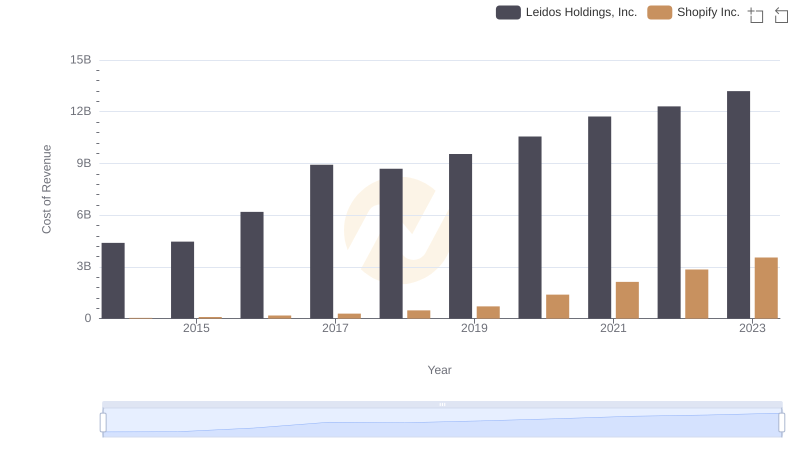
Analyzing Cost of Revenue: Shopify Inc. and Leidos Holdings, Inc.
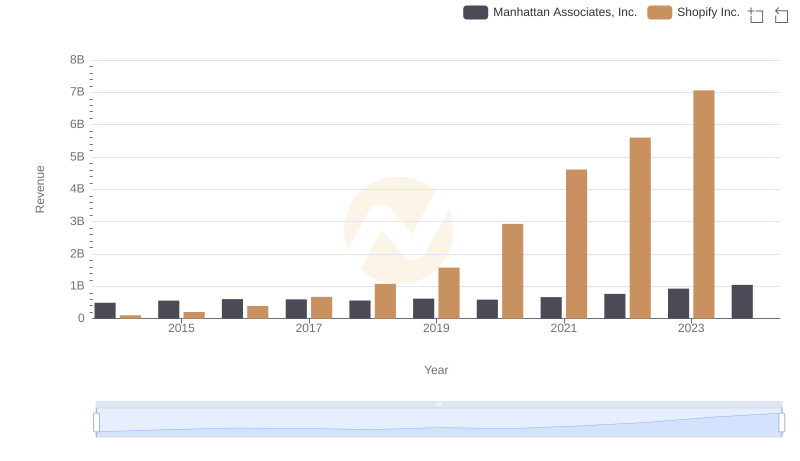
Who Generates More Revenue? Shopify Inc. or Manhattan Associates, Inc.
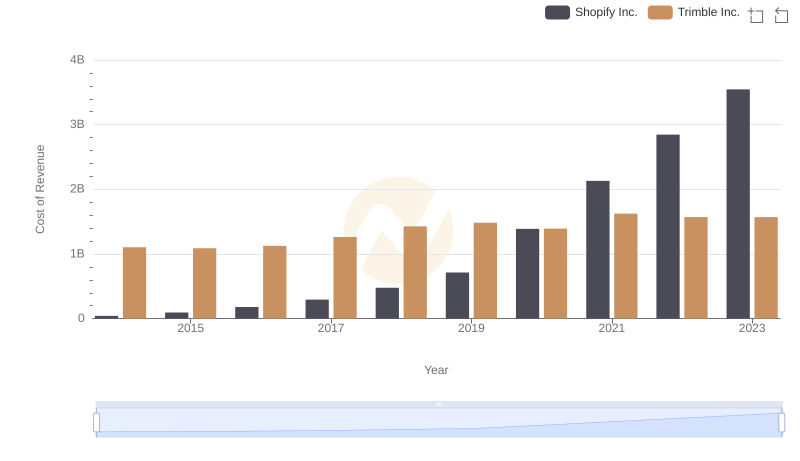
Analyzing Cost of Revenue: Shopify Inc. and Trimble Inc.
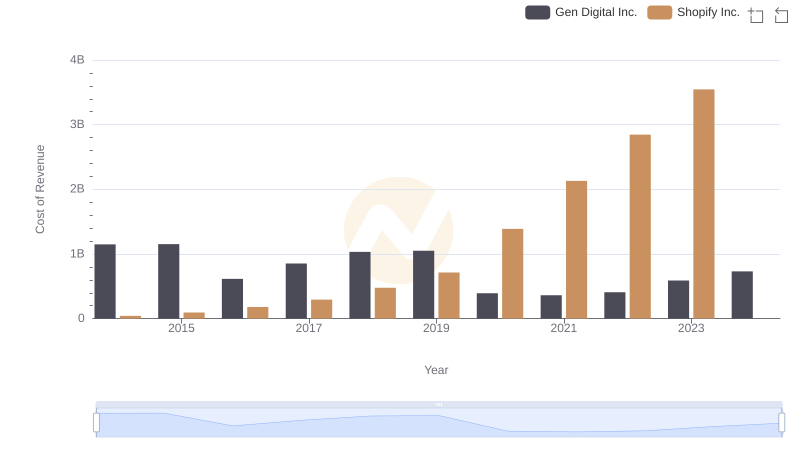
Cost Insights: Breaking Down Shopify Inc. and Gen Digital Inc.'s Expenses
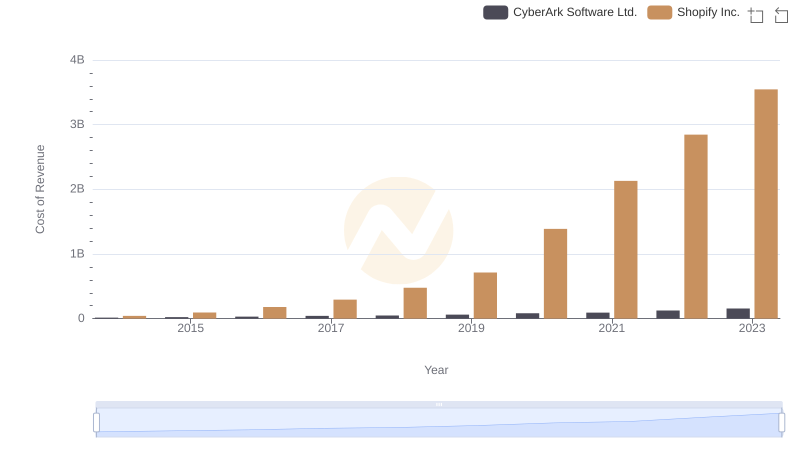
Shopify Inc. vs CyberArk Software Ltd.: Efficiency in Cost of Revenue Explored
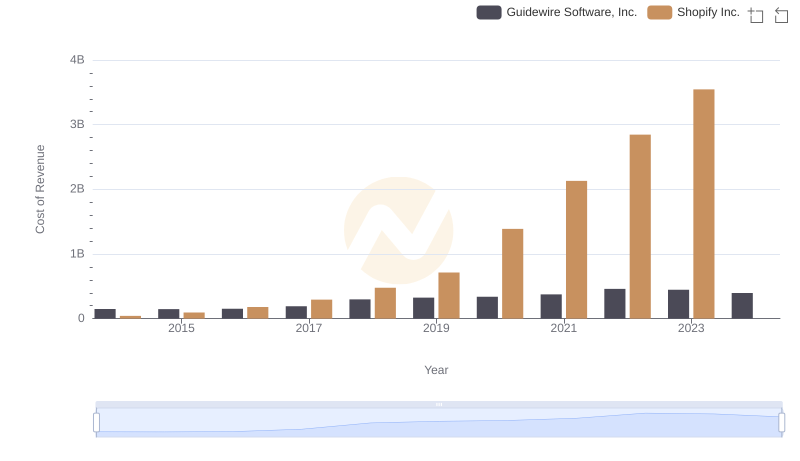
Shopify Inc. vs Guidewire Software, Inc.: Efficiency in Cost of Revenue Explored
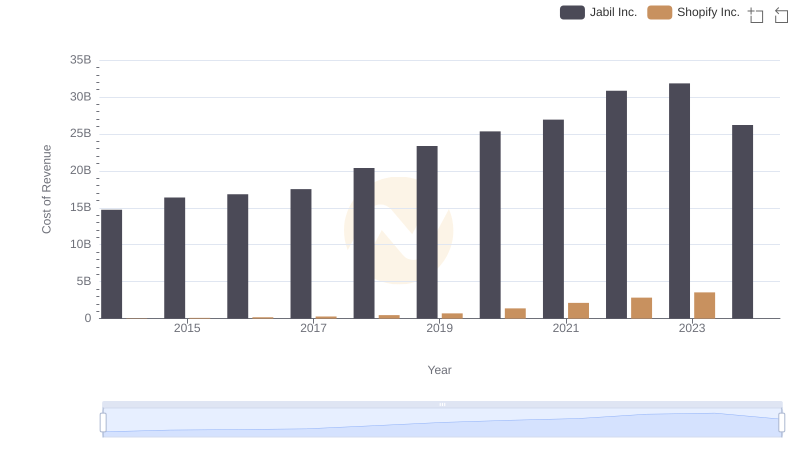
Analyzing Cost of Revenue: Shopify Inc. and Jabil Inc.
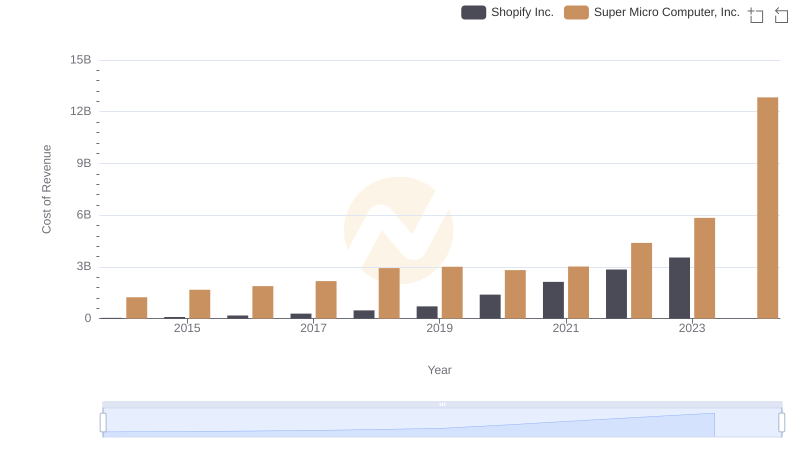
Comparing Cost of Revenue Efficiency: Shopify Inc. vs Super Micro Computer, Inc.
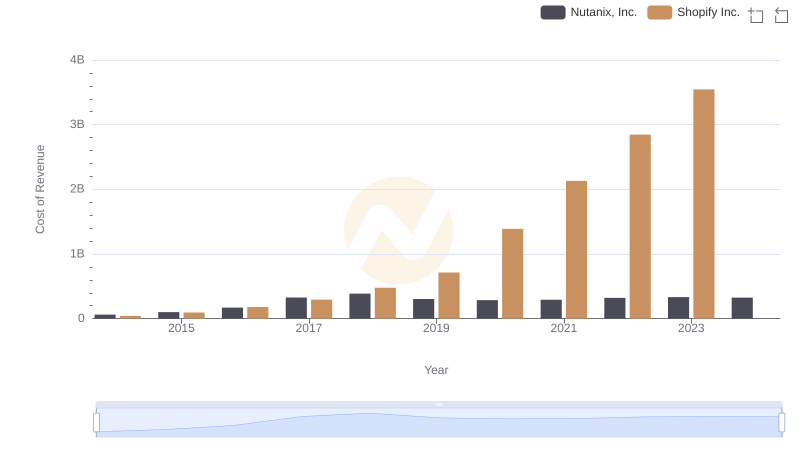
Cost of Revenue Comparison: Shopify Inc. vs Nutanix, Inc.
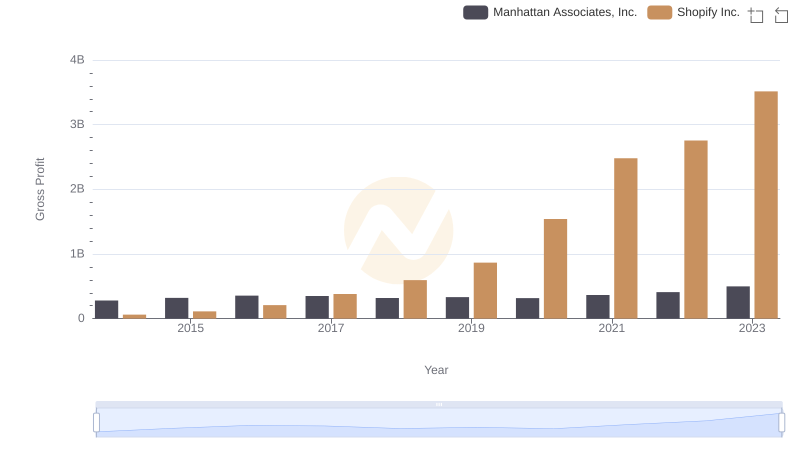
Shopify Inc. vs Manhattan Associates, Inc.: A Gross Profit Performance Breakdown
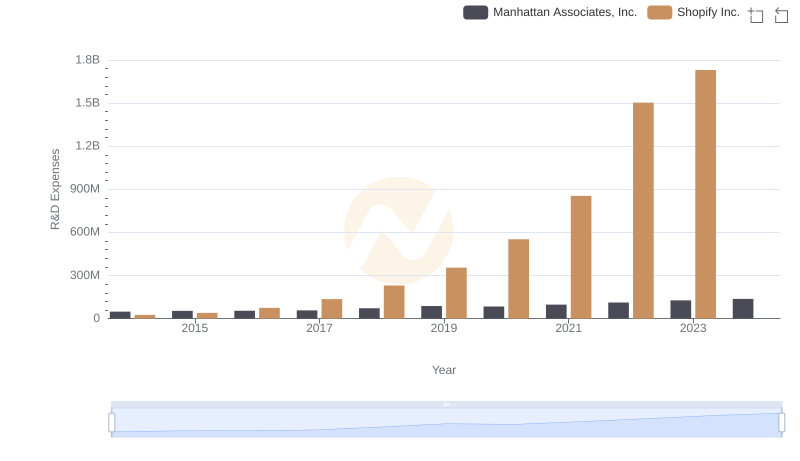
Analyzing R&D Budgets: Shopify Inc. vs Manhattan Associates, Inc.
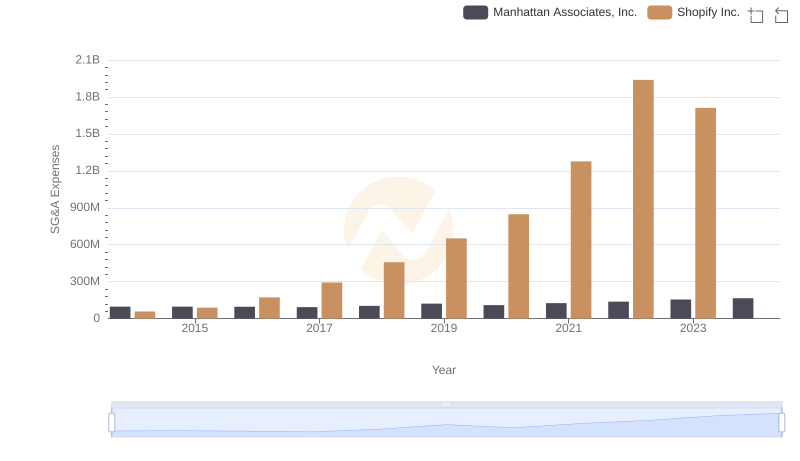
Shopify Inc. or Manhattan Associates, Inc.: Who Manages SG&A Costs Better?