| __timestamp | Micron Technology, Inc. | SAP SE |
|---|---|---|
| Wednesday, January 1, 2014 | 10921000000 | 5272000000 |
| Thursday, January 1, 2015 | 10977000000 | 6626000000 |
| Friday, January 1, 2016 | 9894000000 | 6570000000 |
| Sunday, January 1, 2017 | 11886000000 | 7051000000 |
| Monday, January 1, 2018 | 12500000000 | 7462000000 |
| Tuesday, January 1, 2019 | 12704000000 | 8351000000 |
| Wednesday, January 1, 2020 | 14883000000 | 7886000000 |
| Friday, January 1, 2021 | 17282000000 | 7946000000 |
| Saturday, January 1, 2022 | 16860000000 | 8936000000 |
| Sunday, January 1, 2023 | 16956000000 | 8604000000 |
| Monday, January 1, 2024 | 19498000000 | 9164000000 |
Cracking the code
In the ever-evolving landscape of global technology, understanding cost structures is crucial. From 2014 to 2023, Micron Technology, Inc. and SAP SE have shown distinct trends in their cost of revenue. Micron Technology, a leader in memory and storage solutions, has seen a steady increase, with costs rising by approximately 78% over the decade. This growth reflects its expanding market presence and innovation-driven strategy. In contrast, SAP SE, a titan in enterprise software, experienced a more modest increase of around 63% until 2022, with data for 2023 missing. This difference highlights the varying business models and market dynamics each company faces. While Micron's costs surged, SAP's more stable trajectory underscores its focus on software solutions. These insights offer a window into the strategic priorities and market conditions influencing two of the tech industry's giants.
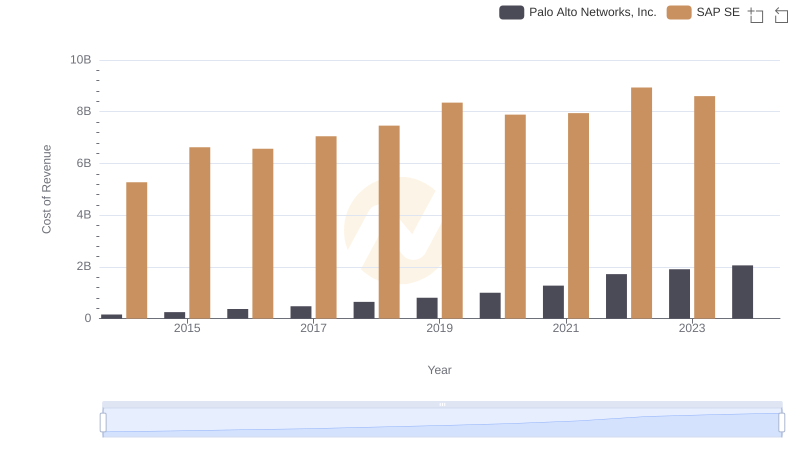
SAP SE vs Palo Alto Networks, Inc.: Efficiency in Cost of Revenue Explored
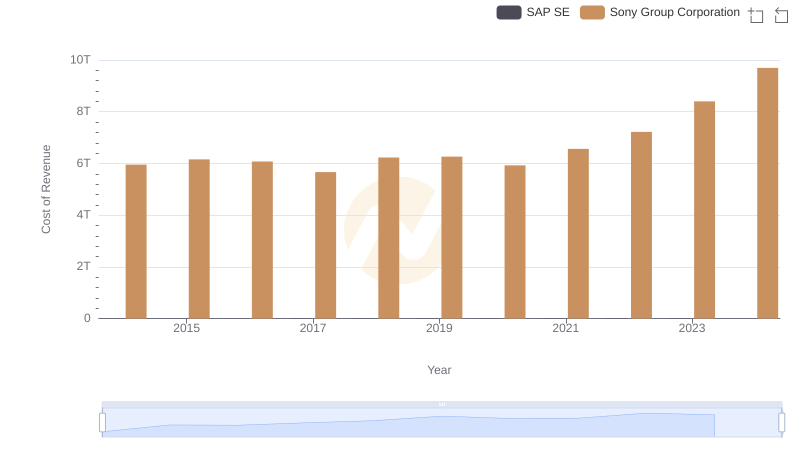
SAP SE vs Sony Group Corporation: Efficiency in Cost of Revenue Explored

Comparing Cost of Revenue Efficiency: SAP SE vs Fiserv, Inc.
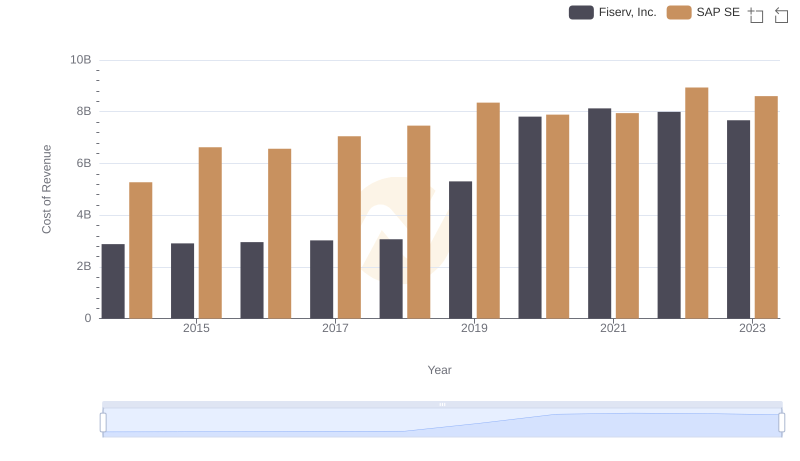
SAP SE vs Fiserv, Inc.: Efficiency in Cost of Revenue Explored
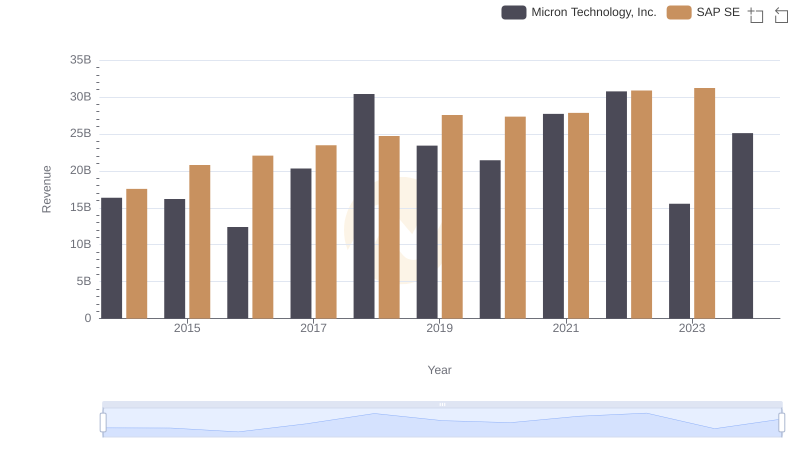
Revenue Showdown: SAP SE vs Micron Technology, Inc.
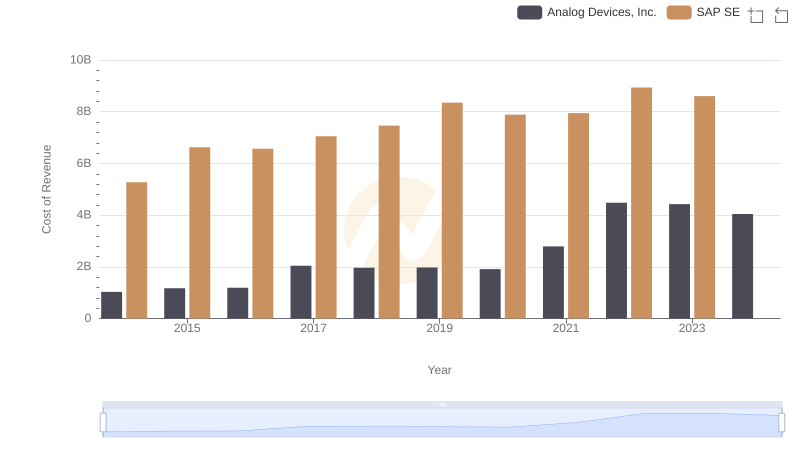
Analyzing Cost of Revenue: SAP SE and Analog Devices, Inc.
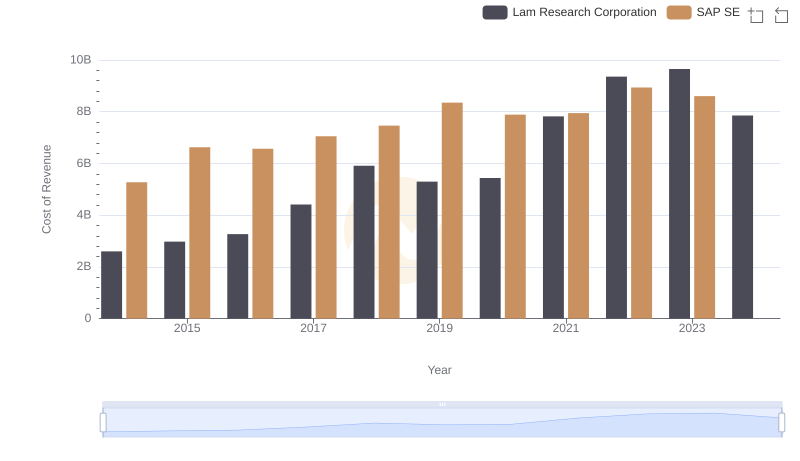
Cost of Revenue Comparison: SAP SE vs Lam Research Corporation
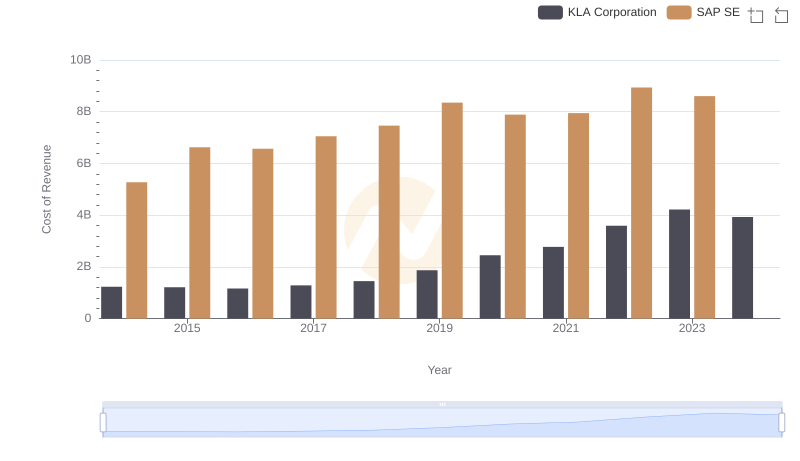
Comparing Cost of Revenue Efficiency: SAP SE vs KLA Corporation
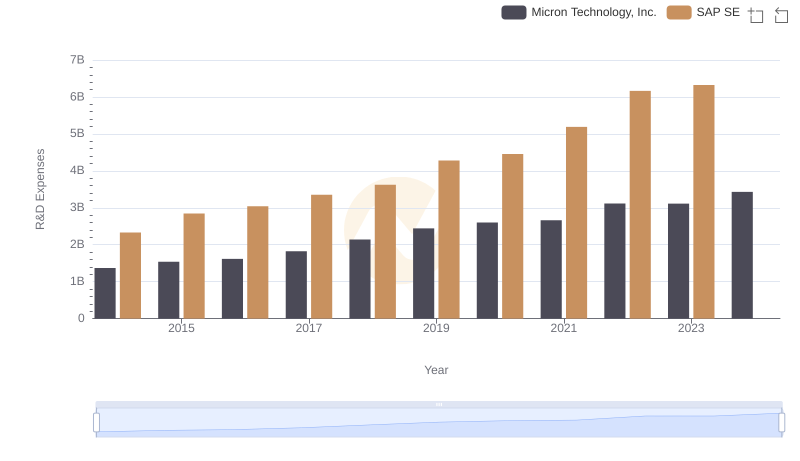
Analyzing R&D Budgets: SAP SE vs Micron Technology, Inc.
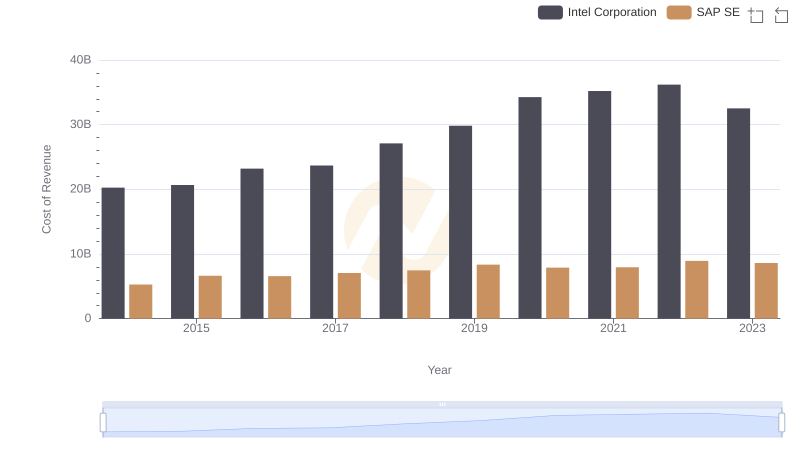
Cost Insights: Breaking Down SAP SE and Intel Corporation's Expenses
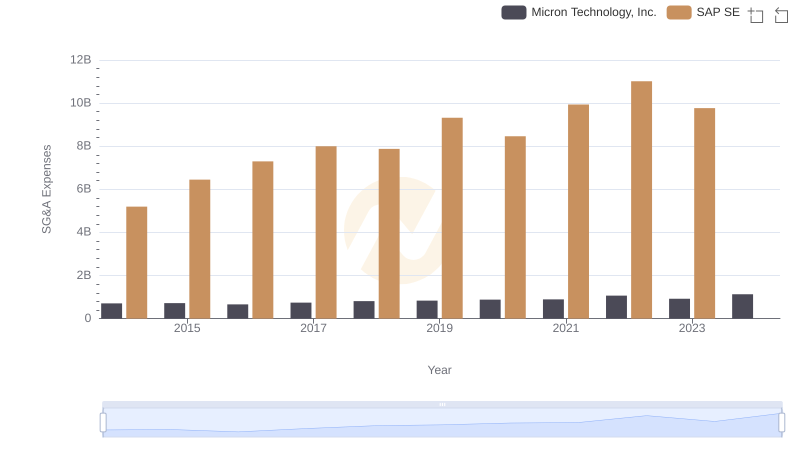
Comparing SG&A Expenses: SAP SE vs Micron Technology, Inc. Trends and Insights
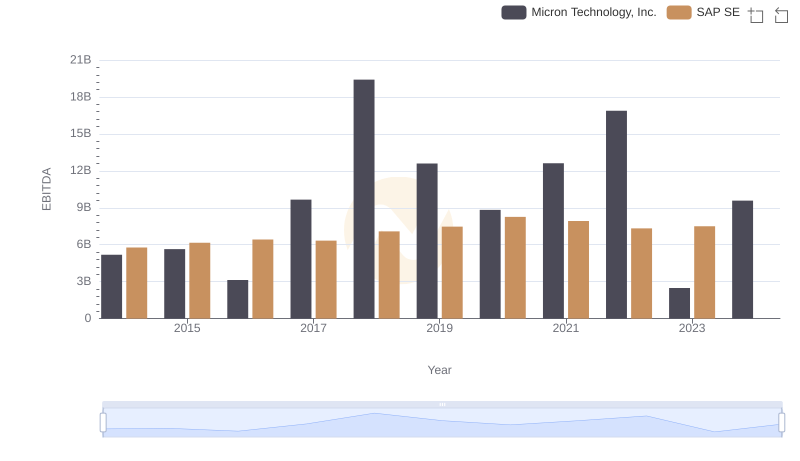
EBITDA Performance Review: SAP SE vs Micron Technology, Inc.