| __timestamp | CGI Inc. | NXP Semiconductors N.V. |
|---|---|---|
| Wednesday, January 1, 2014 | 8263306000 | 3007000000 |
| Thursday, January 1, 2015 | 7980185000 | 3314000000 |
| Friday, January 1, 2016 | 8293407000 | 5429000000 |
| Sunday, January 1, 2017 | 8500825000 | 4637000000 |
| Monday, January 1, 2018 | 9045660000 | 4556000000 |
| Tuesday, January 1, 2019 | 9471661000 | 4259000000 |
| Wednesday, January 1, 2020 | 9420400000 | 4377000000 |
| Friday, January 1, 2021 | 9409971000 | 4996000000 |
| Saturday, January 1, 2022 | 10048149000 | 5688000000 |
| Sunday, January 1, 2023 | 11982421000 | 5723000000 |
| Monday, January 1, 2024 | 12259730000 |
Cracking the code
In the ever-evolving landscape of the semiconductor and IT services industries, understanding cost dynamics is crucial. NXP Semiconductors N.V. and CGI Inc. have shown distinct trends in their cost of revenue from 2014 to 2023. CGI Inc., a leader in IT services, has seen a steady increase in its cost of revenue, rising approximately 48% over the decade. This growth reflects its expanding operations and market reach. In contrast, NXP Semiconductors, a key player in the semiconductor industry, experienced a 90% increase in cost of revenue from 2014 to 2022, highlighting its aggressive expansion and innovation strategies. However, data for 2024 is missing, leaving room for speculation on future trends. These insights provide a window into the strategic maneuvers of these industry titans, offering valuable lessons for investors and industry watchers alike.
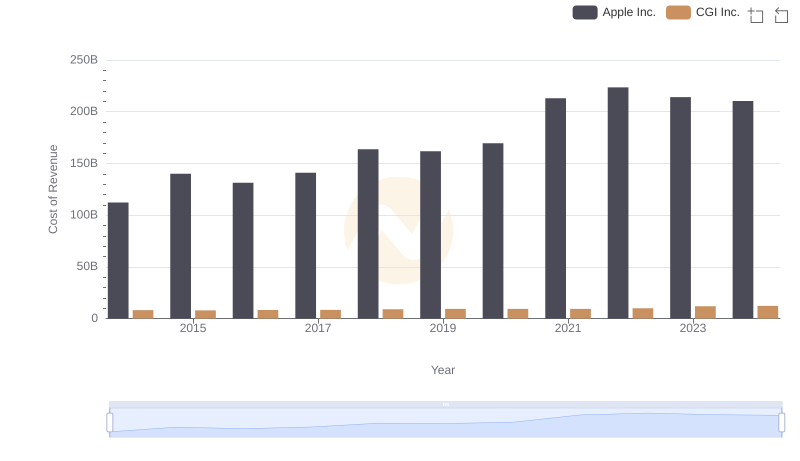
Apple Inc. vs CGI Inc.: Efficiency in Cost of Revenue Explored

Cost of Revenue Comparison: Microsoft Corporation vs NXP Semiconductors N.V.
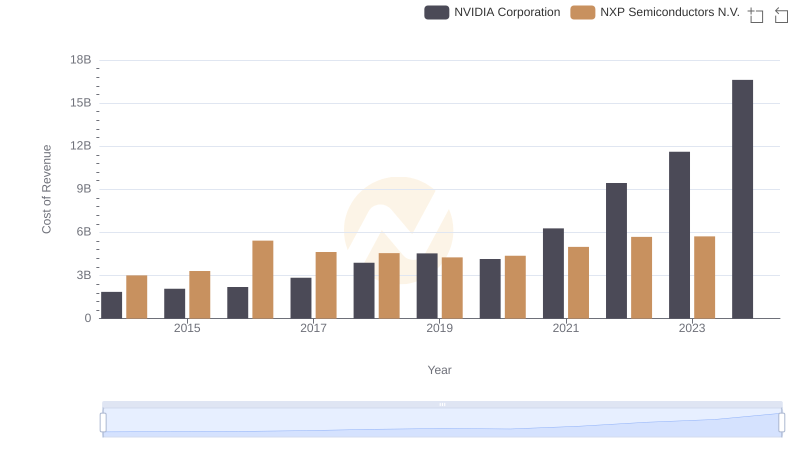
Analyzing Cost of Revenue: NVIDIA Corporation and NXP Semiconductors N.V.
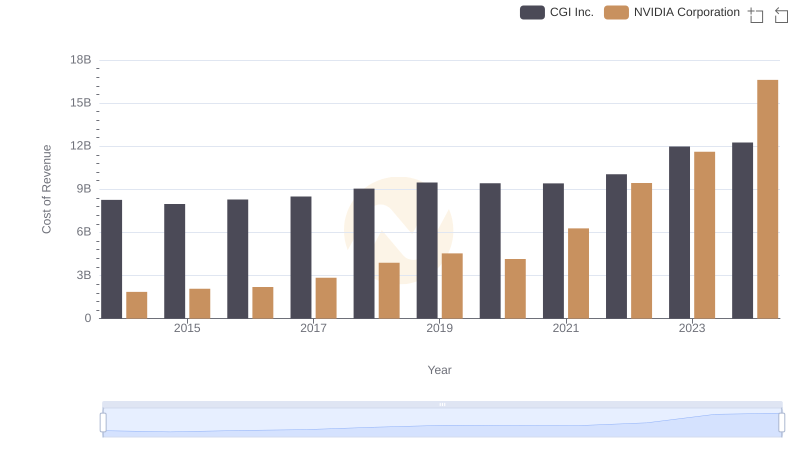
NVIDIA Corporation vs CGI Inc.: Efficiency in Cost of Revenue Explored
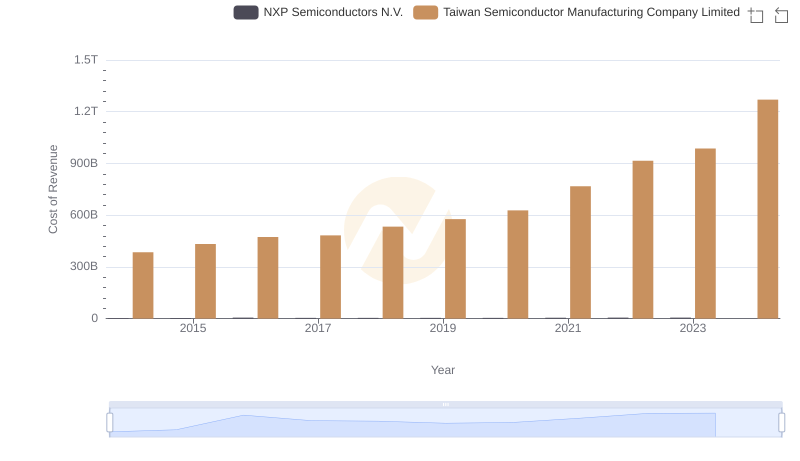
Analyzing Cost of Revenue: Taiwan Semiconductor Manufacturing Company Limited and NXP Semiconductors N.V.
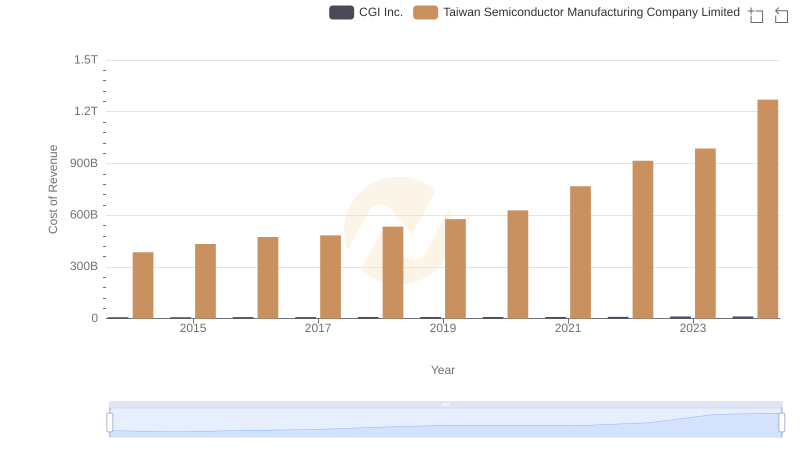
Cost Insights: Breaking Down Taiwan Semiconductor Manufacturing Company Limited and CGI Inc.'s Expenses
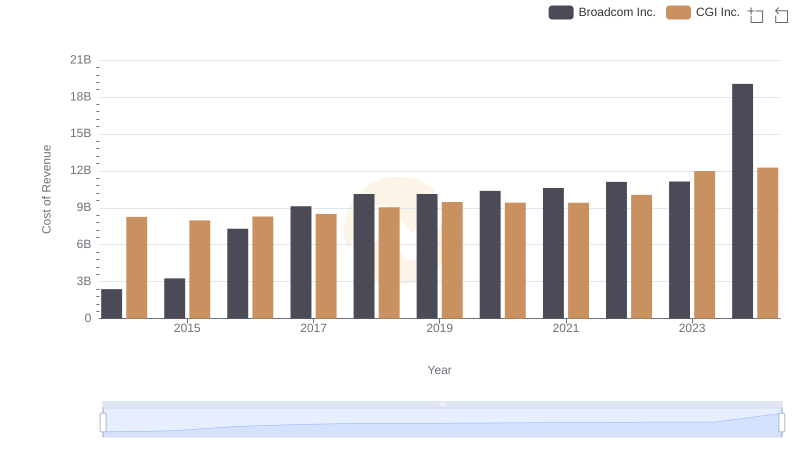
Cost Insights: Breaking Down Broadcom Inc. and CGI Inc.'s Expenses
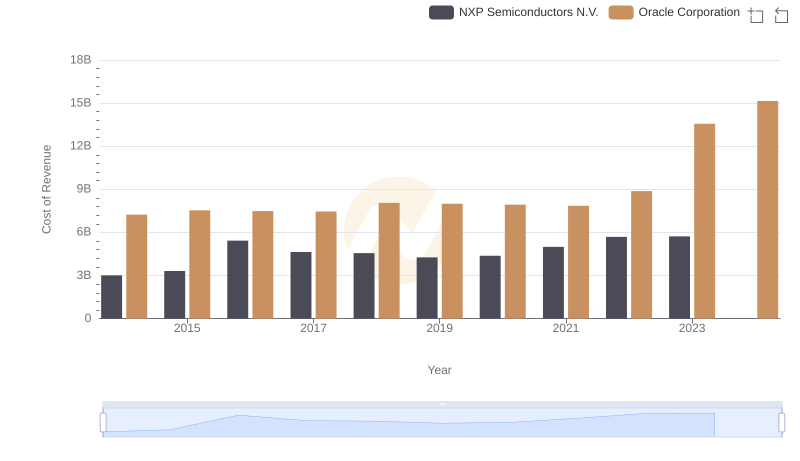
Cost of Revenue Trends: Oracle Corporation vs NXP Semiconductors N.V.
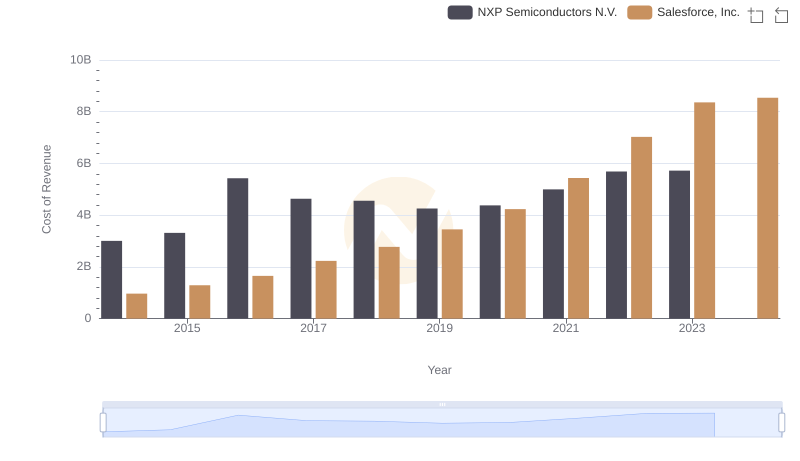
Cost of Revenue Comparison: Salesforce, Inc. vs NXP Semiconductors N.V.
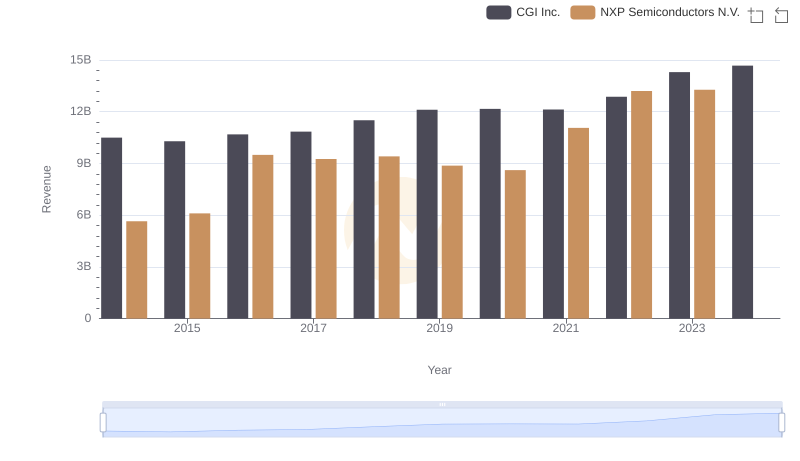
NXP Semiconductors N.V. vs CGI Inc.: Annual Revenue Growth Compared
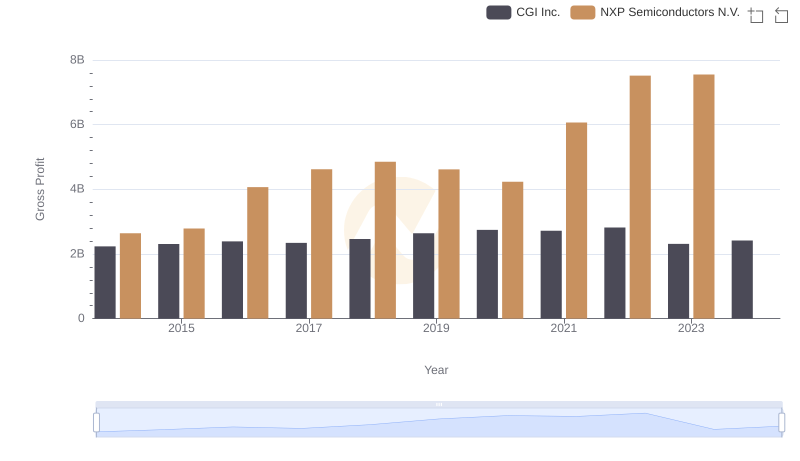
Key Insights on Gross Profit: NXP Semiconductors N.V. vs CGI Inc.
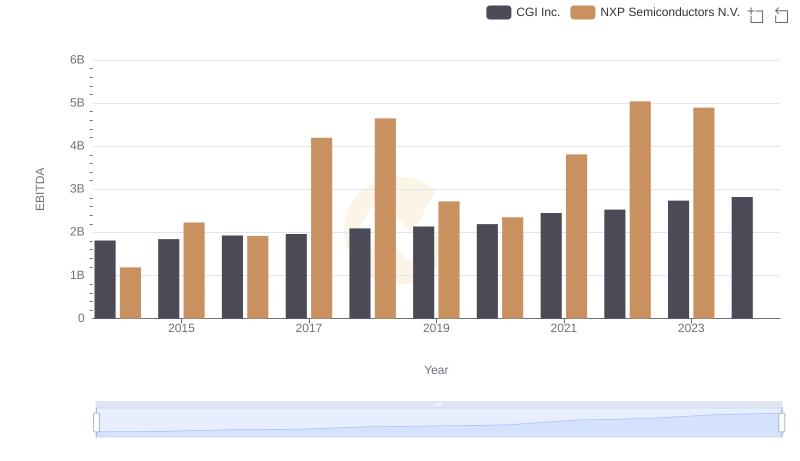
EBITDA Analysis: Evaluating NXP Semiconductors N.V. Against CGI Inc.