| __timestamp | Deere & Company | ITT Inc. |
|---|---|---|
| Wednesday, January 1, 2014 | 24775800000 | 1788200000 |
| Thursday, January 1, 2015 | 20143200000 | 1676500000 |
| Friday, January 1, 2016 | 18248900000 | 1647200000 |
| Sunday, January 1, 2017 | 19933500000 | 1768100000 |
| Monday, January 1, 2018 | 25571200000 | 1857900000 |
| Tuesday, January 1, 2019 | 26792000000 | 1936300000 |
| Wednesday, January 1, 2020 | 23677000000 | 1695600000 |
| Friday, January 1, 2021 | 29116000000 | 1865500000 |
| Saturday, January 1, 2022 | 35338000000 | 2065400000 |
| Sunday, January 1, 2023 | 40105000000 | 2175700000 |
| Monday, January 1, 2024 | 30775000000 | 2383400000 |
Infusing magic into the data realm
In the ever-evolving landscape of industrial manufacturing, Deere & Company and ITT Inc. have carved distinct paths over the past decade. From 2014 to 2023, Deere & Company, a titan in agricultural machinery, saw its cost of revenue soar by approximately 62%, peaking in 2023. This reflects its aggressive expansion and adaptation to global agricultural demands. In contrast, ITT Inc., a leader in engineered components, experienced a more modest 22% increase over the same period, highlighting its steady yet cautious growth strategy.
Interestingly, 2024 data for ITT Inc. remains elusive, leaving analysts speculating about its future trajectory. As these companies navigate the complexities of global markets, their cost of revenue trends offer a window into their strategic priorities and operational efficiencies. Stay tuned as we delve deeper into what these numbers mean for investors and industry stakeholders.
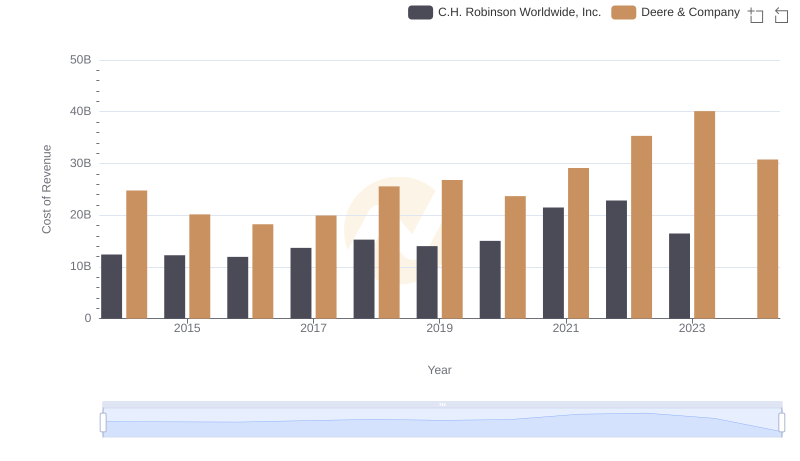
Cost Insights: Breaking Down Deere & Company and C.H. Robinson Worldwide, Inc.'s Expenses
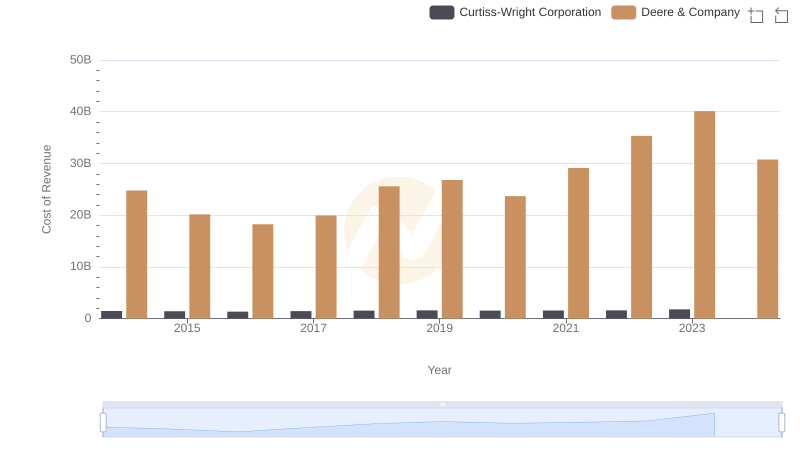
Analyzing Cost of Revenue: Deere & Company and Curtiss-Wright Corporation
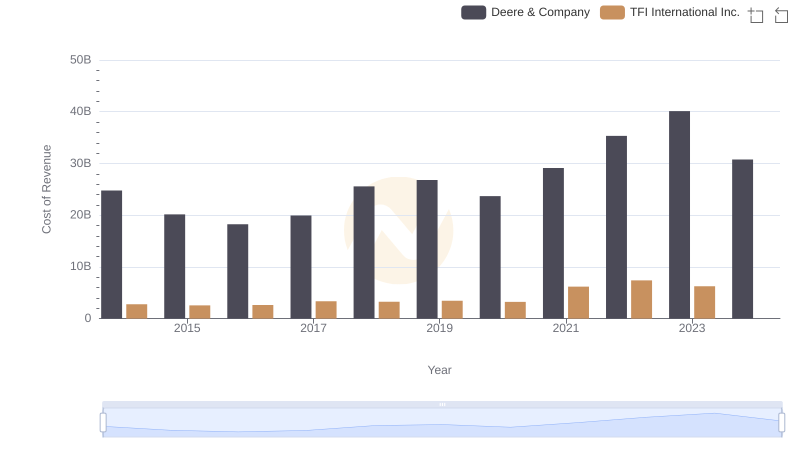
Analyzing Cost of Revenue: Deere & Company and TFI International Inc.
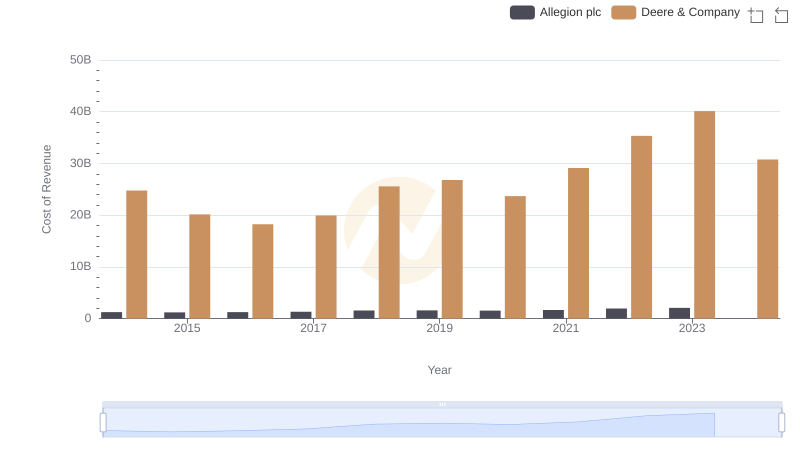
Cost of Revenue Comparison: Deere & Company vs Allegion plc
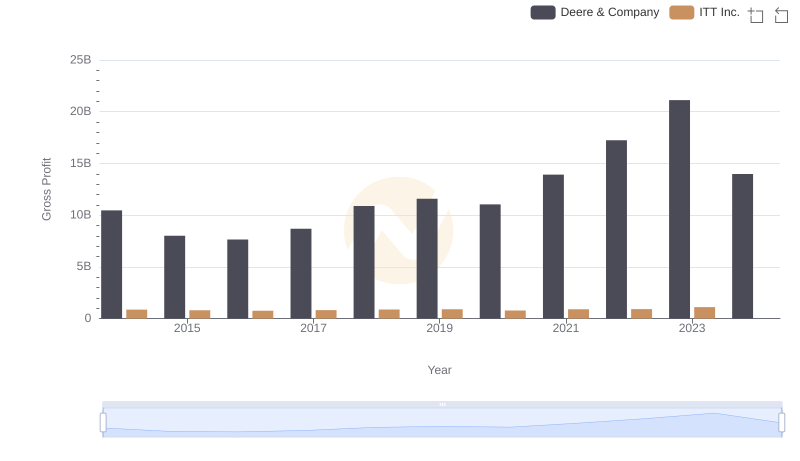
Deere & Company and ITT Inc.: A Detailed Gross Profit Analysis