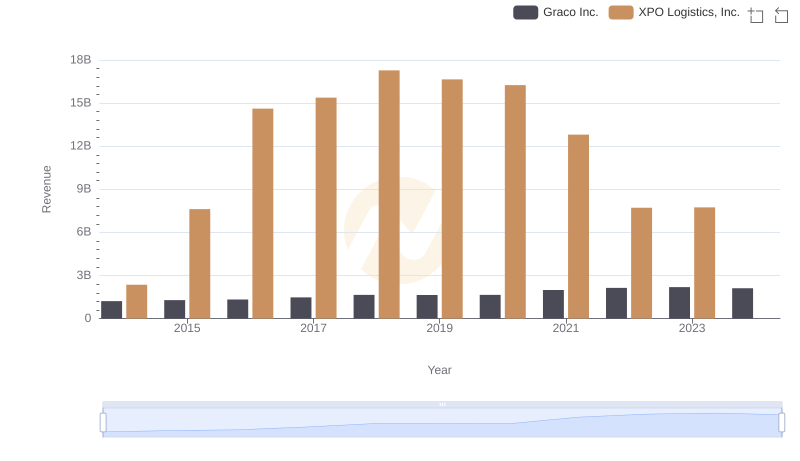
| __timestamp | Graco Inc. | XPO Logistics, Inc. |
|---|---|---|
| Wednesday, January 1, 2014 | 554394000 | 1975000000 |
| Thursday, January 1, 2015 | 601785000 | 6538400000 |
| Friday, January 1, 2016 | 621054000 | 12480100000 |
| Sunday, January 1, 2017 | 681695000 | 13101100000 |
| Monday, January 1, 2018 | 770753000 | 14738000000 |
| Tuesday, January 1, 2019 | 786289000 | 13982000000 |
| Wednesday, January 1, 2020 | 795178000 | 13689000000 |
| Friday, January 1, 2021 | 953659000 | 10812000000 |
| Saturday, January 1, 2022 | 1086082000 | 6491000000 |
| Sunday, January 1, 2023 | 1034585000 | 6974000000 |
| Monday, January 1, 2024 | 990855000 | 7157000000 |
Data in motion
In the ever-evolving landscape of logistics and manufacturing, understanding cost dynamics is crucial. Over the past decade, XPO Logistics, Inc. and Graco Inc. have showcased distinct trajectories in their cost of revenue. From 2014 to 2023, Graco Inc. experienced a steady increase, peaking in 2022 with a 96% rise from 2014. Meanwhile, XPO Logistics, Inc. saw a dramatic surge, reaching its zenith in 2018 with a 647% increase from 2014, before a notable decline by 2022. This divergence highlights the contrasting operational strategies and market conditions faced by these industry giants. The data for 2024 remains incomplete, offering a tantalizing glimpse into future trends. As businesses navigate post-pandemic challenges, these insights provide a valuable lens into cost management strategies.
XPO Logistics, Inc. vs Graco Inc.: Examining Key Revenue Metrics
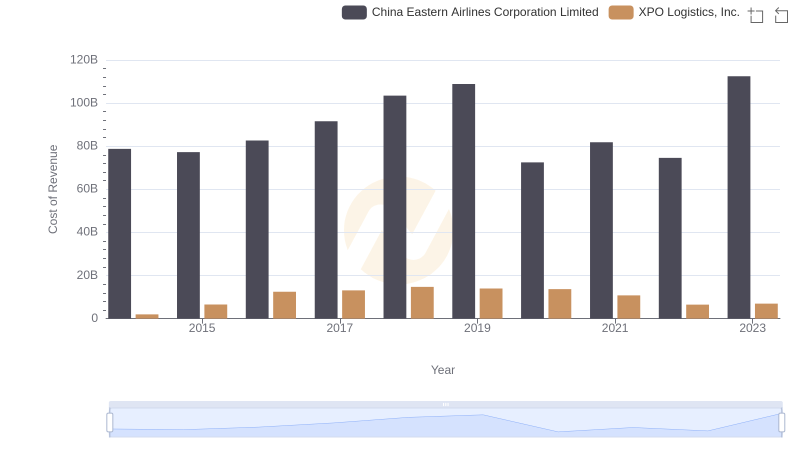
XPO Logistics, Inc. vs China Eastern Airlines Corporation Limited: Efficiency in Cost of Revenue Explored
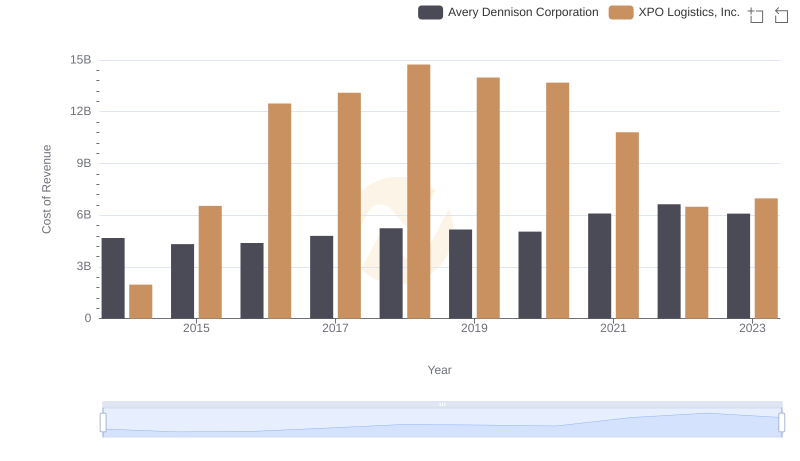
Cost Insights: Breaking Down XPO Logistics, Inc. and Avery Dennison Corporation's Expenses

Cost of Revenue Comparison: XPO Logistics, Inc. vs ZTO Express (Cayman) Inc.

Gross Profit Comparison: XPO Logistics, Inc. and Graco Inc. Trends
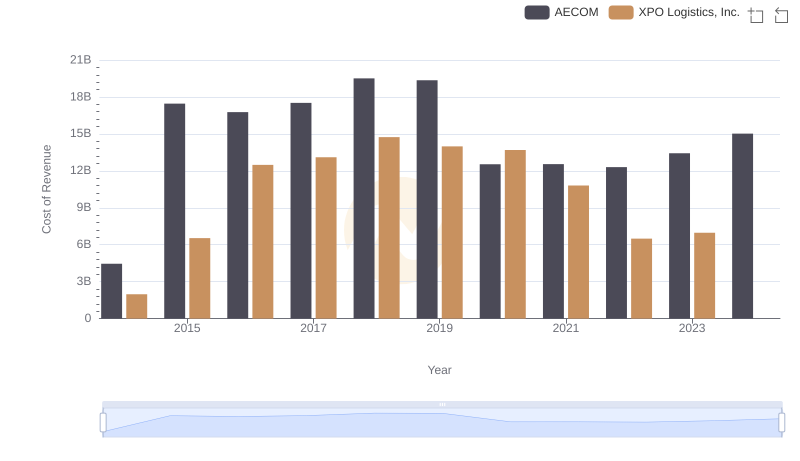
Cost of Revenue: Key Insights for XPO Logistics, Inc. and AECOM

XPO Logistics, Inc. and Graco Inc.: SG&A Spending Patterns Compared
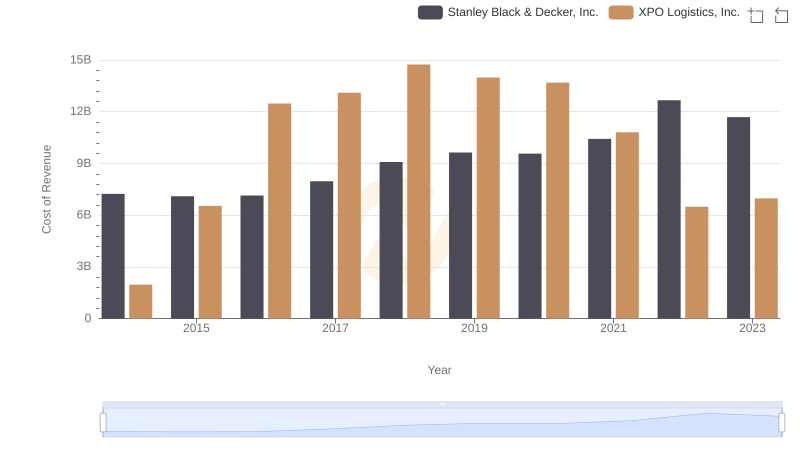
Cost Insights: Breaking Down XPO Logistics, Inc. and Stanley Black & Decker, Inc.'s Expenses