| __timestamp | Automatic Data Processing, Inc. | RTX Corporation |
|---|---|---|
| Wednesday, January 1, 2014 | 7221400000 | 47447000000 |
| Thursday, January 1, 2015 | 6427600000 | 40431000000 |
| Friday, January 1, 2016 | 6840300000 | 41460000000 |
| Sunday, January 1, 2017 | 7269800000 | 43953000000 |
| Monday, January 1, 2018 | 7842600000 | 49985000000 |
| Tuesday, January 1, 2019 | 8086600000 | 57065000000 |
| Wednesday, January 1, 2020 | 8445100000 | 48056000000 |
| Friday, January 1, 2021 | 8640300000 | 51897000000 |
| Saturday, January 1, 2022 | 9461900000 | 53406000000 |
| Sunday, January 1, 2023 | 9953400000 | 56831000000 |
| Monday, January 1, 2024 | 10476700000 | 65328000000 |
In pursuit of knowledge
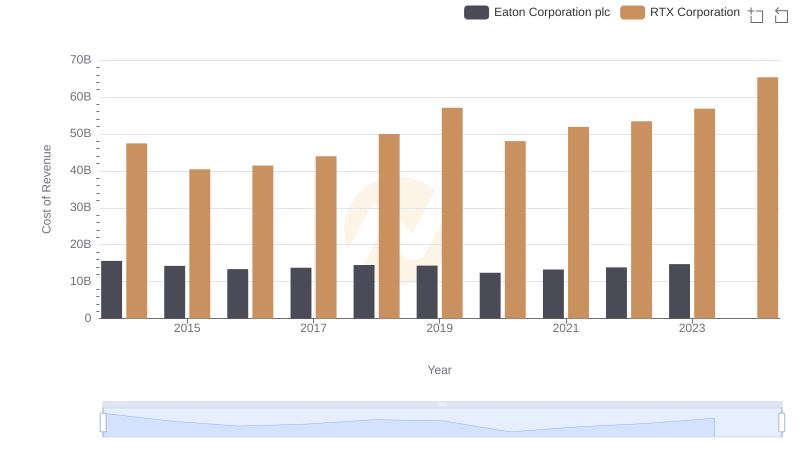
In the ever-evolving landscape of corporate finance, understanding the cost of revenue is crucial for evaluating a company's efficiency and profitability. Over the past decade, RTX Corporation and Automatic Data Processing, Inc. (ADP) have demonstrated distinct trajectories in their cost of revenue.
From 2014 to 2024, RTX Corporation's cost of revenue has seen a steady increase, peaking at approximately 65% higher in 2024 compared to 2014. This growth reflects RTX's expanding operations and market presence. In contrast, ADP's cost of revenue has grown by about 45% over the same period, indicating a more conservative expansion strategy.
These trends highlight the differing business models and market strategies of these two giants. While RTX focuses on scaling operations, ADP emphasizes efficiency and cost management. Investors and analysts should consider these insights when evaluating potential investment opportunities in these companies.