| __timestamp | Fortinet, Inc. | Take-Two Interactive Software, Inc. |
|---|---|---|
| Wednesday, January 1, 2014 | 231009000 | 1414327000 |
| Thursday, January 1, 2015 | 286777000 | 794867000 |
| Friday, January 1, 2016 | 337837000 | 813873000 |
| Sunday, January 1, 2017 | 385284000 | 1022959000 |
| Monday, January 1, 2018 | 450400000 | 898311000 |
| Tuesday, January 1, 2019 | 505900000 | 1523644000 |
| Wednesday, January 1, 2020 | 570000000 | 1542450000 |
| Friday, January 1, 2021 | 783000000 | 1535085000 |
| Saturday, January 1, 2022 | 1084900000 | 1535401000 |
| Sunday, January 1, 2023 | 1237200000 | 3064600000 |
| Monday, January 1, 2024 | 1157600000 | 3107800000 |
Unveiling the hidden dimensions of data
In the ever-evolving landscape of technology and entertainment, understanding the cost of revenue is crucial for investors and analysts alike. Fortinet, Inc., a leader in cybersecurity, and Take-Two Interactive Software, Inc., a giant in the gaming industry, present intriguing case studies. From 2014 to 2023, Fortinet's cost of revenue surged by over 400%, reflecting its aggressive expansion and increased operational scale. In contrast, Take-Two Interactive's cost of revenue grew by approximately 116%, with a notable spike in 2023, likely due to blockbuster game releases.
While Fortinet's growth trajectory is steady, Take-Two's fluctuates, hinting at the cyclical nature of the gaming industry. The absence of data for Fortinet in 2024 suggests a potential shift or anomaly worth investigating. This analysis underscores the dynamic nature of these industries and the importance of strategic financial management.
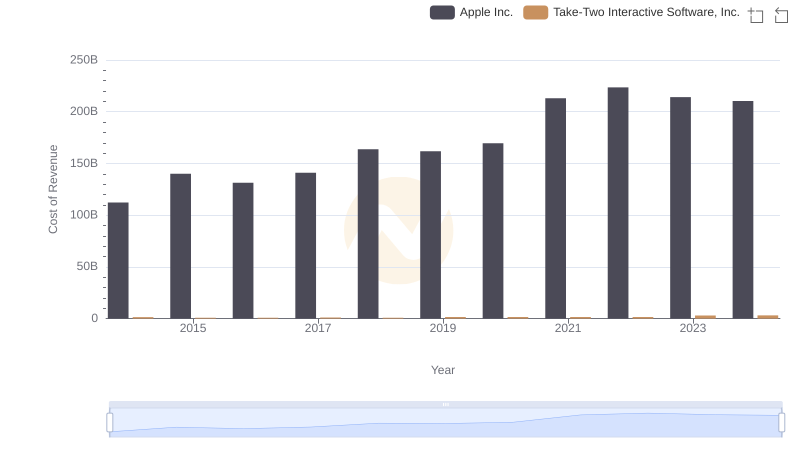
Apple Inc. vs Take-Two Interactive Software, Inc.: Efficiency in Cost of Revenue Explored
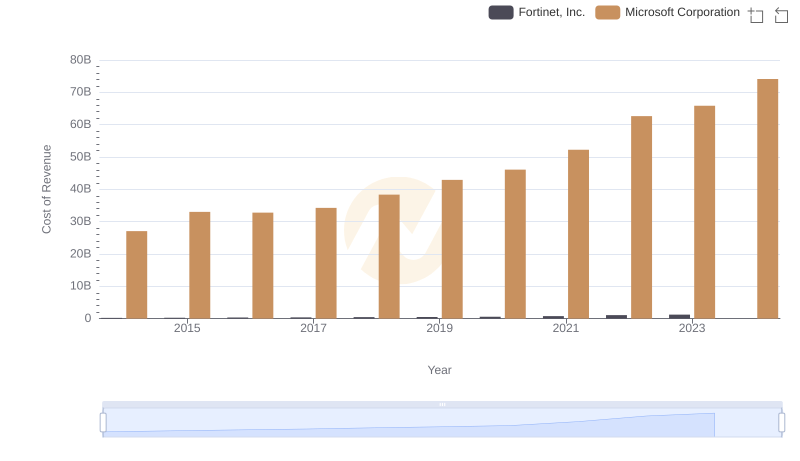
Cost of Revenue Comparison: Microsoft Corporation vs Fortinet, Inc.
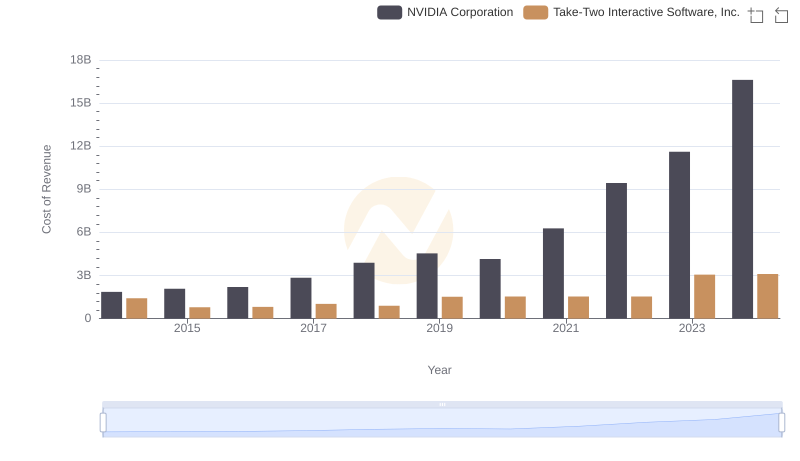
Cost Insights: Breaking Down NVIDIA Corporation and Take-Two Interactive Software, Inc.'s Expenses
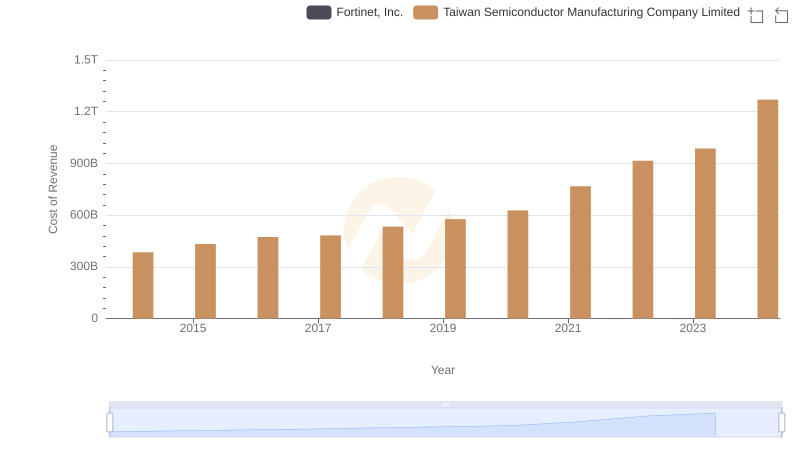
Cost Insights: Breaking Down Taiwan Semiconductor Manufacturing Company Limited and Fortinet, Inc.'s Expenses
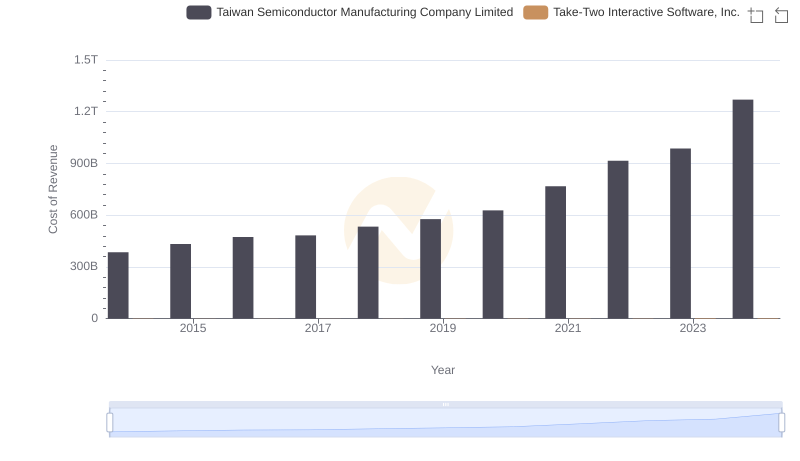
Taiwan Semiconductor Manufacturing Company Limited vs Take-Two Interactive Software, Inc.: Efficiency in Cost of Revenue Explored
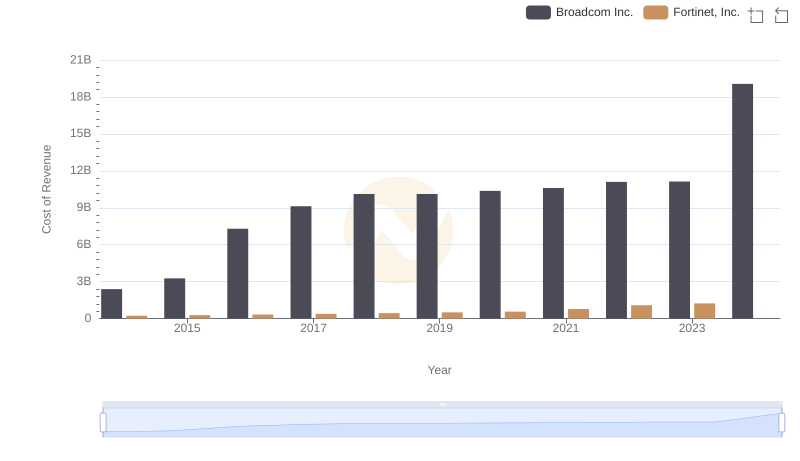
Cost of Revenue: Key Insights for Broadcom Inc. and Fortinet, Inc.
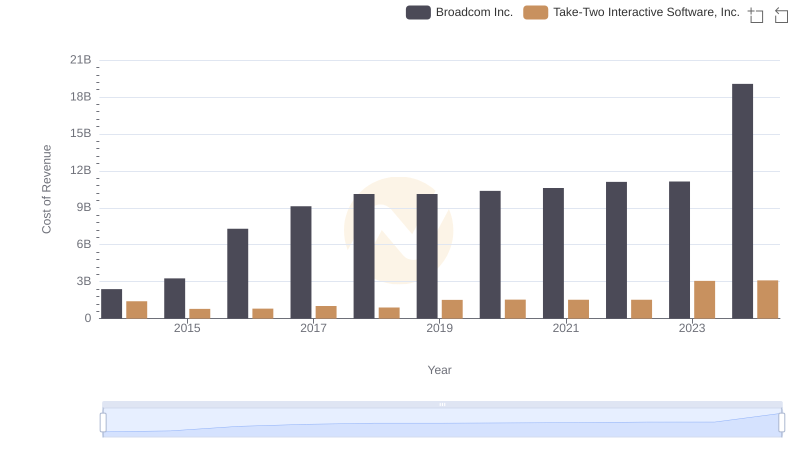
Comparing Cost of Revenue Efficiency: Broadcom Inc. vs Take-Two Interactive Software, Inc.
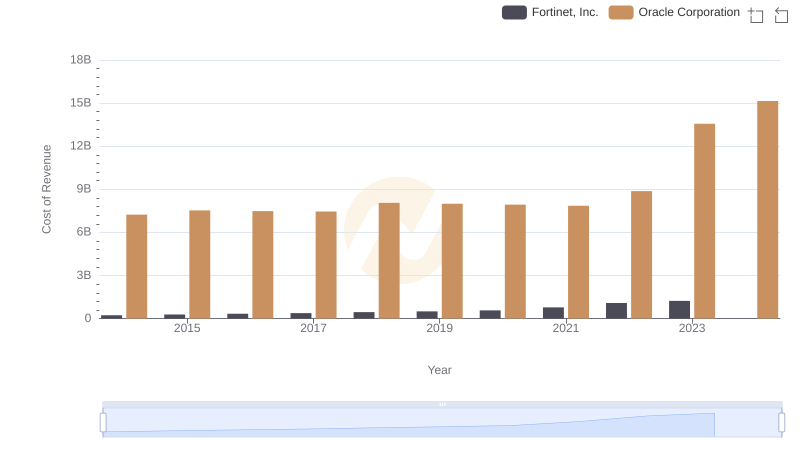
Cost of Revenue: Key Insights for Oracle Corporation and Fortinet, Inc.
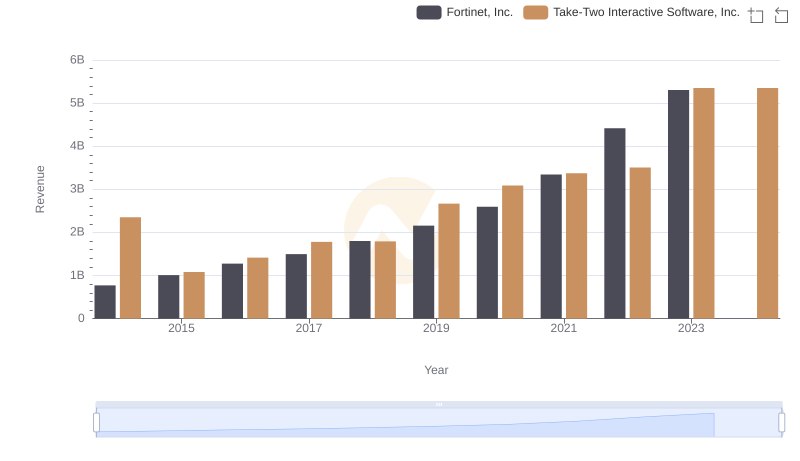
Revenue Insights: Fortinet, Inc. and Take-Two Interactive Software, Inc. Performance Compared
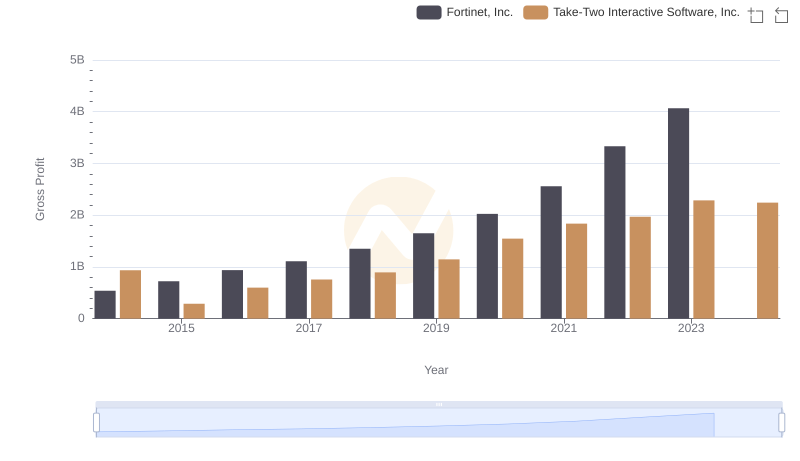
Who Generates Higher Gross Profit? Fortinet, Inc. or Take-Two Interactive Software, Inc.
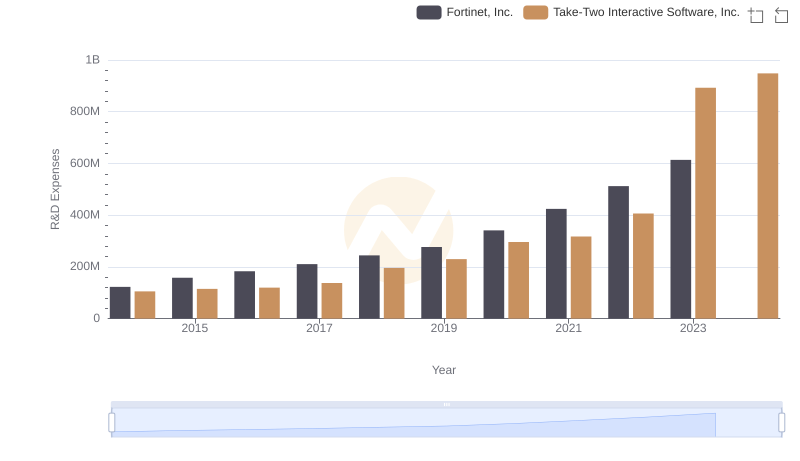
Research and Development Investment: Fortinet, Inc. vs Take-Two Interactive Software, Inc.
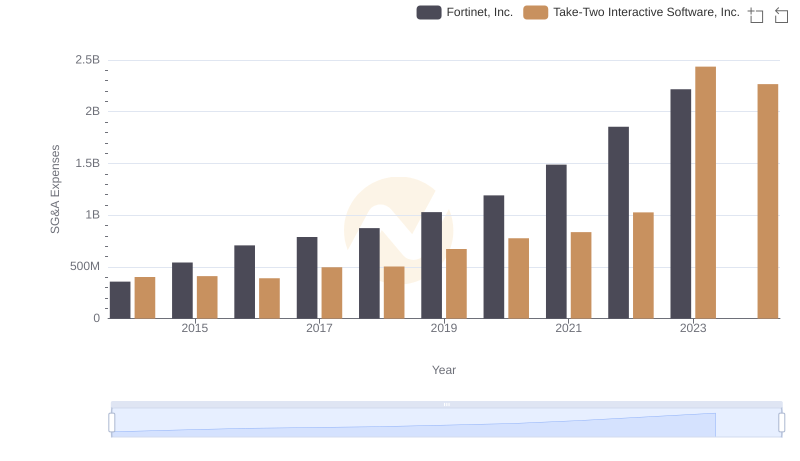
Who Optimizes SG&A Costs Better? Fortinet, Inc. or Take-Two Interactive Software, Inc.