| __timestamp | Deere & Company | HEICO Corporation |
|---|---|---|
| Wednesday, January 1, 2014 | 24775800000 | 733999000 |
| Thursday, January 1, 2015 | 20143200000 | 754469000 |
| Friday, January 1, 2016 | 18248900000 | 860766000 |
| Sunday, January 1, 2017 | 19933500000 | 950088000 |
| Monday, January 1, 2018 | 25571200000 | 1087006000 |
| Tuesday, January 1, 2019 | 26792000000 | 1241807000 |
| Wednesday, January 1, 2020 | 23677000000 | 1104882000 |
| Friday, January 1, 2021 | 29116000000 | 1138259000 |
| Saturday, January 1, 2022 | 35338000000 | 1345563000 |
| Sunday, January 1, 2023 | 40105000000 | 1814617000 |
| Monday, January 1, 2024 | 30775000000 | 2355943000 |
Data in motion
In the ever-evolving landscape of industrial giants, understanding cost efficiency is paramount. Over the past decade, Deere & Company and HEICO Corporation have showcased contrasting trajectories in their cost of revenue. Deere & Company, a leader in agricultural machinery, saw a 62% increase in cost of revenue from 2014 to 2023, peaking in 2023. This reflects its aggressive expansion and innovation strategies. Meanwhile, HEICO Corporation, a key player in aerospace and electronics, experienced a more modest 147% rise over the same period, indicating steady growth and cost management.
These insights provide a window into the strategic priorities and market dynamics influencing these industry leaders.
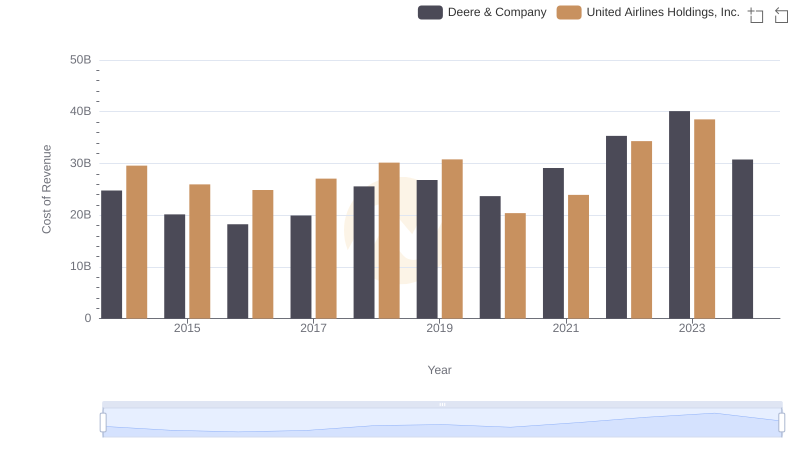
Analyzing Cost of Revenue: Deere & Company and United Airlines Holdings, Inc.
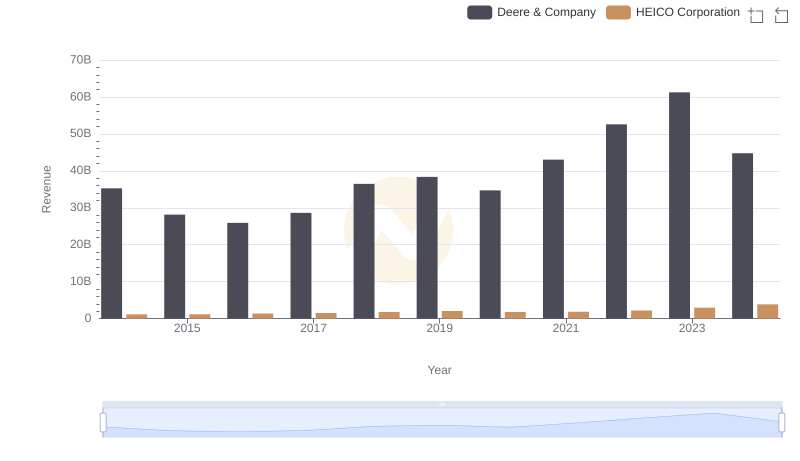
Revenue Showdown: Deere & Company vs HEICO Corporation

Cost of Revenue: Key Insights for Deere & Company and Equifax Inc.
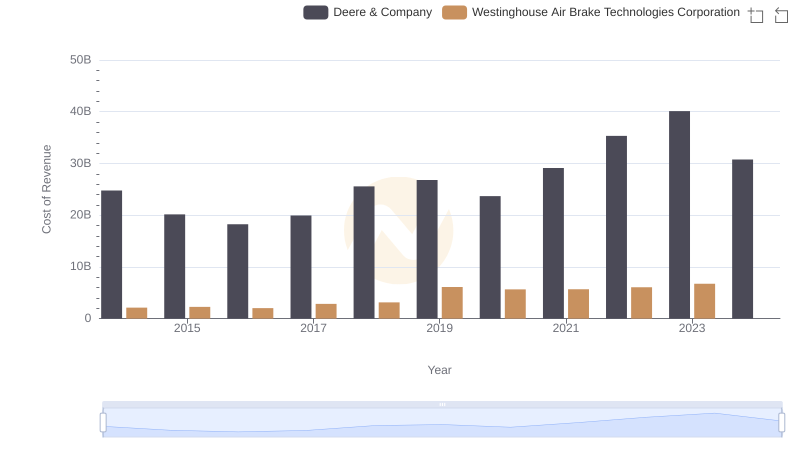
Cost of Revenue: Key Insights for Deere & Company and Westinghouse Air Brake Technologies Corporation

Analyzing Cost of Revenue: Deere & Company and Ferrovial SE
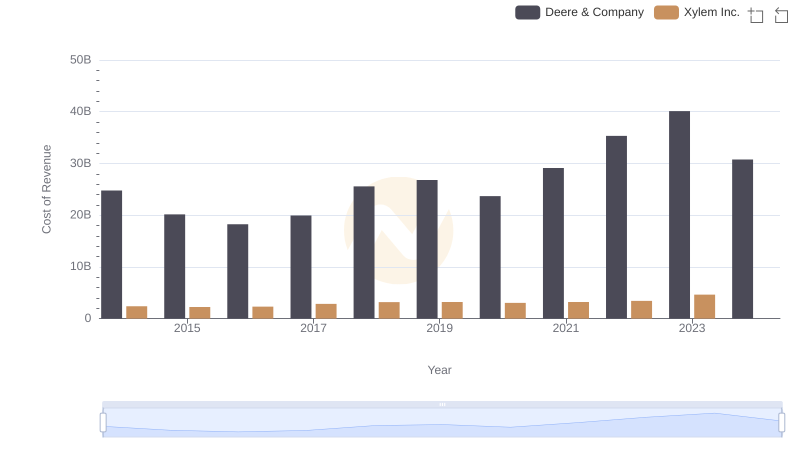
Deere & Company vs Xylem Inc.: Efficiency in Cost of Revenue Explored
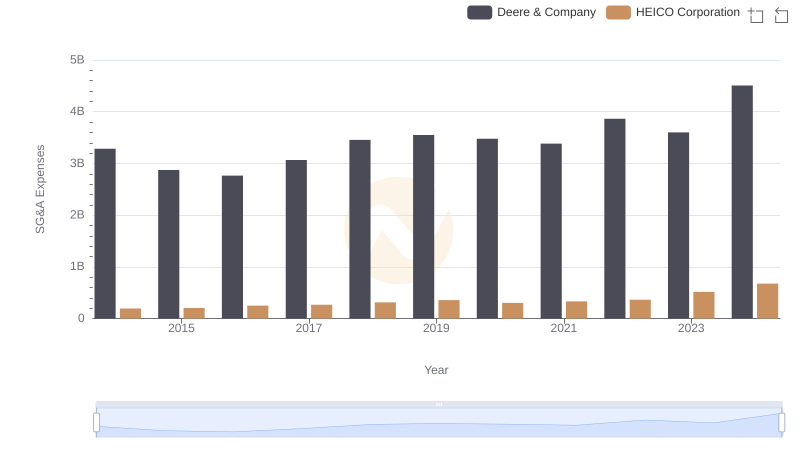
Deere & Company or HEICO Corporation: Who Manages SG&A Costs Better?