| __timestamp | Allegion plc | Curtiss-Wright Corporation |
|---|---|---|
| Wednesday, January 1, 2014 | 1264600000 | 1466610000 |
| Thursday, January 1, 2015 | 1199000000 | 1422428000 |
| Friday, January 1, 2016 | 1252700000 | 1358448000 |
| Sunday, January 1, 2017 | 1337500000 | 1452431000 |
| Monday, January 1, 2018 | 1558400000 | 1540574000 |
| Tuesday, January 1, 2019 | 1601700000 | 1589216000 |
| Wednesday, January 1, 2020 | 1541100000 | 1550109000 |
| Friday, January 1, 2021 | 1662500000 | 1572575000 |
| Saturday, January 1, 2022 | 1949500000 | 1602416000 |
| Sunday, January 1, 2023 | 2069300000 | 1778195000 |
| Monday, January 1, 2024 | 2103700000 | 1967640000 |
Unlocking the unknown
In the ever-evolving landscape of industrial manufacturing, understanding cost structures is crucial. From 2014 to 2023, Allegion plc and Curtiss-Wright Corporation have shown distinct trends in their cost of revenue. Allegion plc's cost of revenue surged by approximately 64% over this period, peaking in 2023. This growth reflects strategic investments and possibly increased production efficiency. In contrast, Curtiss-Wright Corporation experienced a more modest increase of around 21%, with a notable spike in 2023. This suggests a stable cost management strategy, aligning with their focus on aerospace and defense sectors.
The data reveals that while both companies have navigated economic fluctuations, Allegion's aggressive growth strategy has led to a higher cost of revenue. Meanwhile, Curtiss-Wright's steady approach highlights their commitment to sustainable growth. These insights provide a window into the financial health and strategic priorities of these industry leaders.
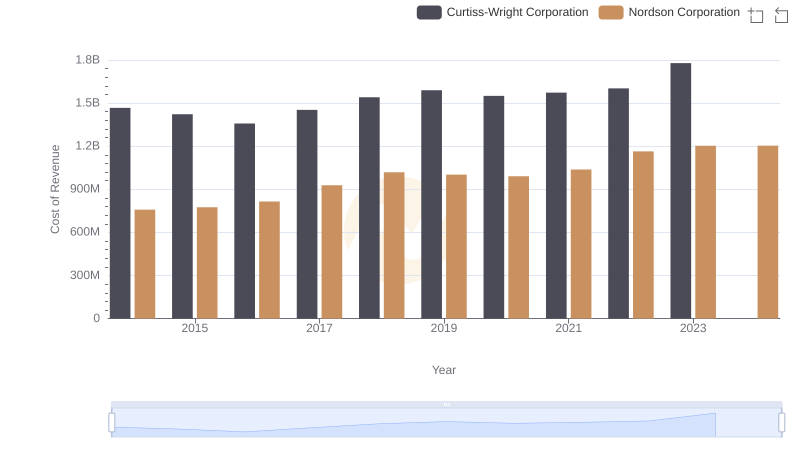
Analyzing Cost of Revenue: Curtiss-Wright Corporation and Nordson Corporation
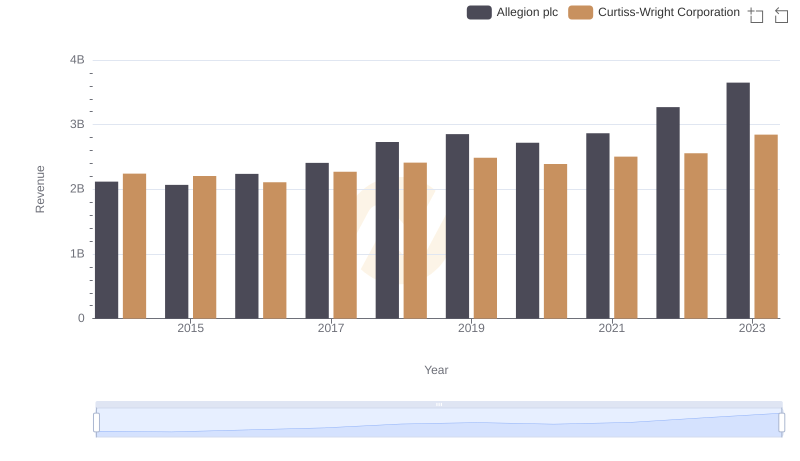
Curtiss-Wright Corporation and Allegion plc: A Comprehensive Revenue Analysis
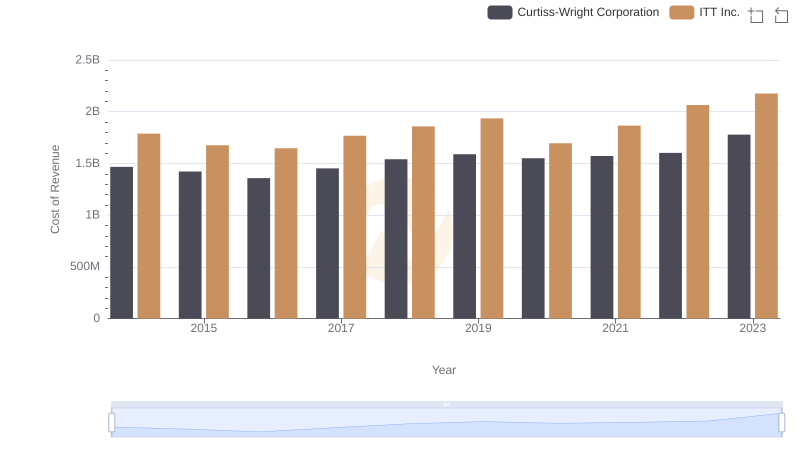
Curtiss-Wright Corporation vs ITT Inc.: Efficiency in Cost of Revenue Explored
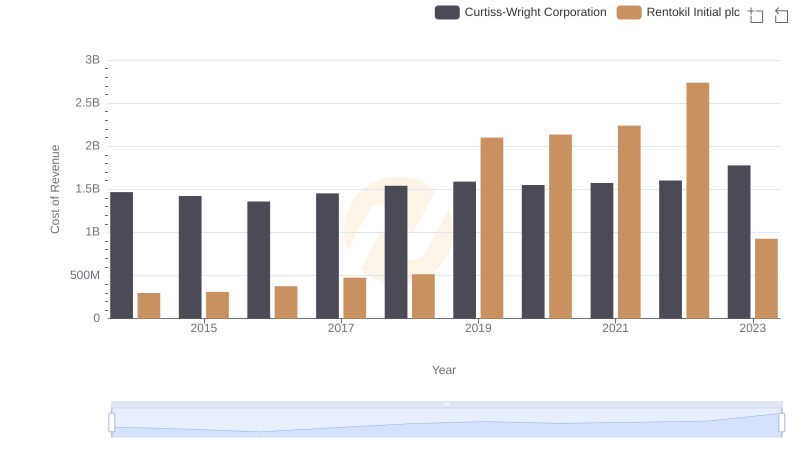
Analyzing Cost of Revenue: Curtiss-Wright Corporation and Rentokil Initial plc
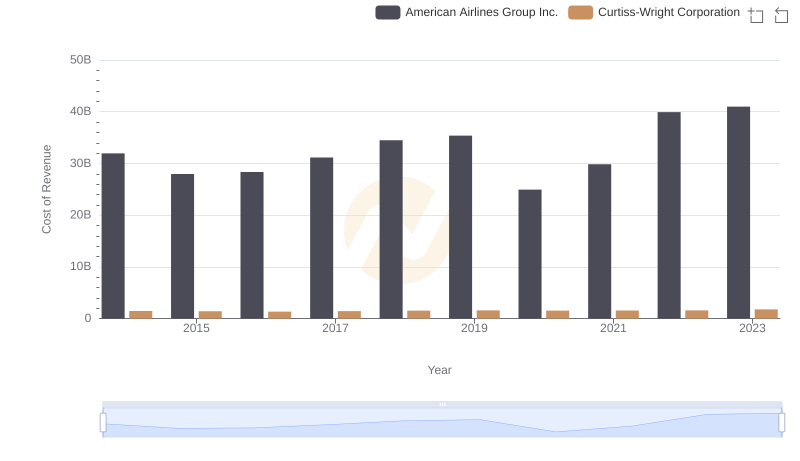
Cost of Revenue Trends: Curtiss-Wright Corporation vs American Airlines Group Inc.
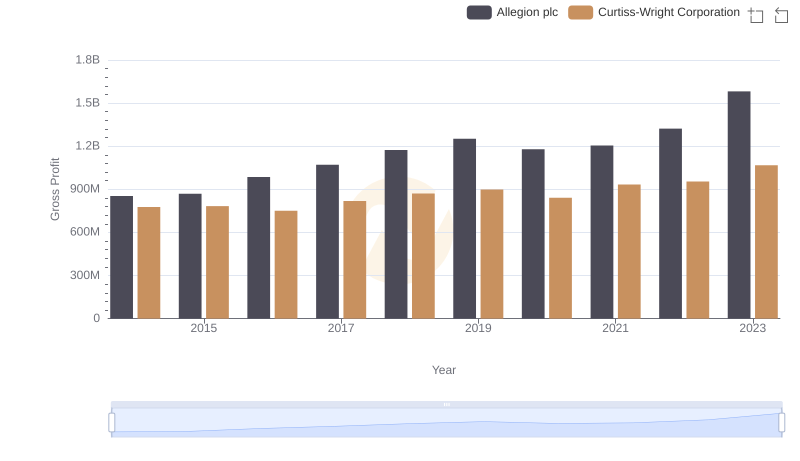
Curtiss-Wright Corporation vs Allegion plc: A Gross Profit Performance Breakdown
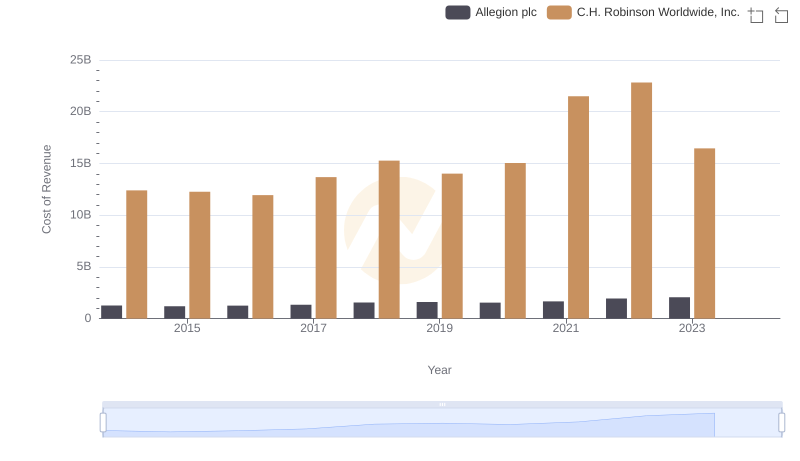
Analyzing Cost of Revenue: C.H. Robinson Worldwide, Inc. and Allegion plc
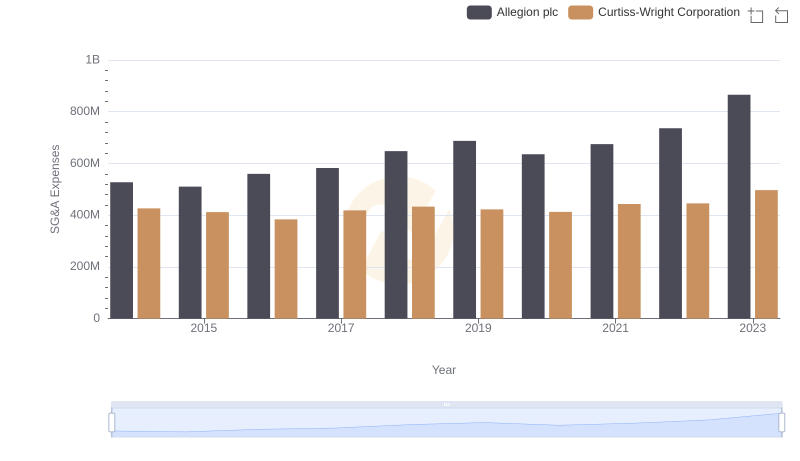
Cost Management Insights: SG&A Expenses for Curtiss-Wright Corporation and Allegion plc
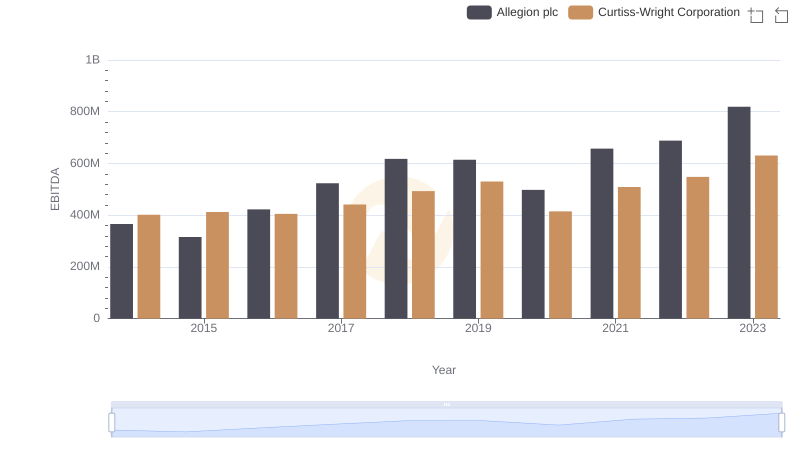
EBITDA Metrics Evaluated: Curtiss-Wright Corporation vs Allegion plc