| __timestamp | Fiserv, Inc. | Taiwan Semiconductor Manufacturing Company Limited |
|---|---|---|
| Wednesday, January 1, 2014 | 2881000000 | 385113000000 |
| Thursday, January 1, 2015 | 2909000000 | 433117600000 |
| Friday, January 1, 2016 | 2959000000 | 473077100000 |
| Sunday, January 1, 2017 | 3024000000 | 482616200000 |
| Monday, January 1, 2018 | 3069000000 | 533487500000 |
| Tuesday, January 1, 2019 | 5309000000 | 577283500000 |
| Wednesday, January 1, 2020 | 7812000000 | 628124700000 |
| Friday, January 1, 2021 | 8128000000 | 767877700000 |
| Saturday, January 1, 2022 | 7992000000 | 915536500000 |
| Sunday, January 1, 2023 | 7670000000 | 986625000000 |
| Monday, January 1, 2024 | 0 | 1269954000000 |
Igniting the spark of knowledge
In the ever-evolving landscape of global technology and financial services, Taiwan Semiconductor Manufacturing Company Limited (TSMC) and Fiserv, Inc. stand as titans in their respective fields. Over the past decade, TSMC has consistently outpaced Fiserv in terms of cost of revenue, reflecting its massive scale and pivotal role in the semiconductor industry. From 2014 to 2023, TSMC's cost of revenue surged by approximately 156%, reaching nearly 986 billion USD in 2023. In contrast, Fiserv's cost of revenue grew by about 166% over the same period, peaking at around 8 billion USD in 2021 before slightly declining. This comparison highlights the stark difference in scale between the two companies, with TSMC's cost of revenue being over 100 times that of Fiserv. The data for 2024 is incomplete, but the trend suggests TSMC's dominance will continue.
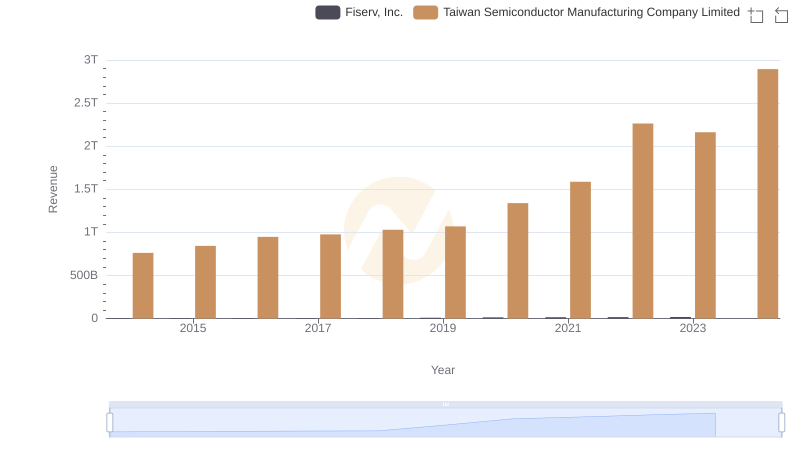
Taiwan Semiconductor Manufacturing Company Limited vs Fiserv, Inc.: Annual Revenue Growth Compared
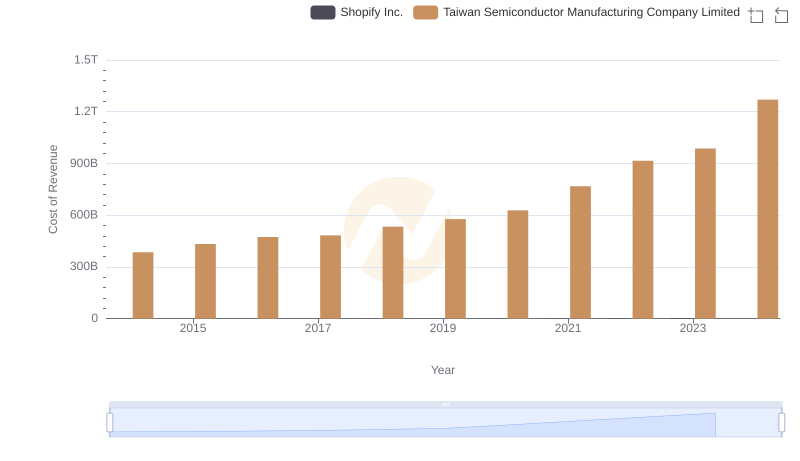
Cost Insights: Breaking Down Taiwan Semiconductor Manufacturing Company Limited and Shopify Inc.'s Expenses
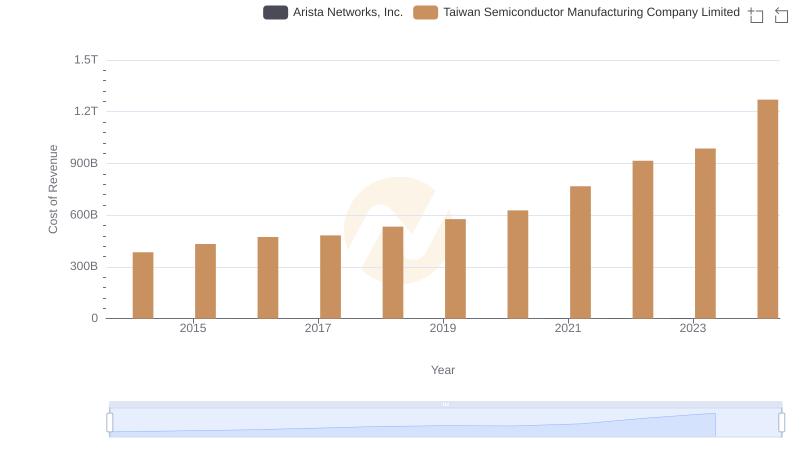
Analyzing Cost of Revenue: Taiwan Semiconductor Manufacturing Company Limited and Arista Networks, Inc.
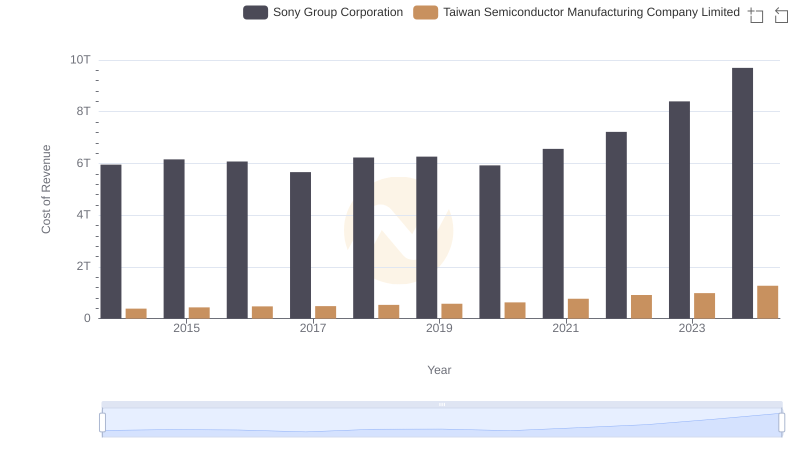
Cost of Revenue Trends: Taiwan Semiconductor Manufacturing Company Limited vs Sony Group Corporation

Comparing Revenue Performance: Taiwan Semiconductor Manufacturing Company Limited or Fiserv, Inc.?

Gross Profit Comparison: Taiwan Semiconductor Manufacturing Company Limited and Fiserv, Inc. Trends

Cost Insights: Breaking Down Taiwan Semiconductor Manufacturing Company Limited and Fiserv, Inc.'s Expenses
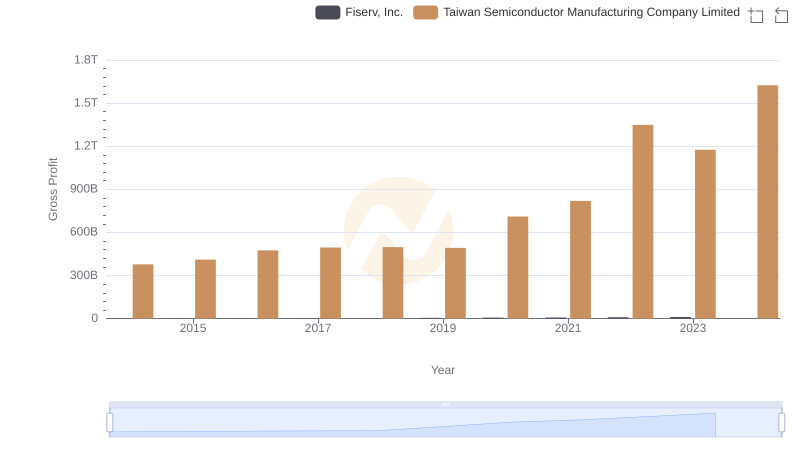
Taiwan Semiconductor Manufacturing Company Limited vs Fiserv, Inc.: A Gross Profit Performance Breakdown
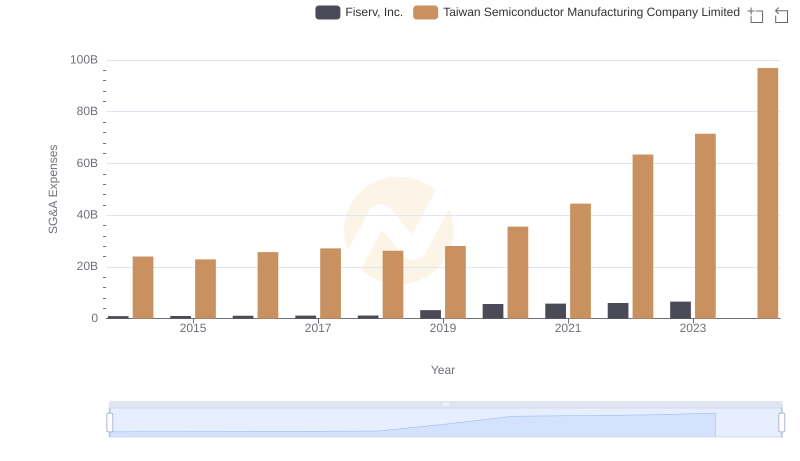
Taiwan Semiconductor Manufacturing Company Limited vs Fiserv, Inc.: SG&A Expense Trends

EBITDA Performance Review: Taiwan Semiconductor Manufacturing Company Limited vs Fiserv, Inc.

SG&A Efficiency Analysis: Comparing Taiwan Semiconductor Manufacturing Company Limited and Fiserv, Inc.
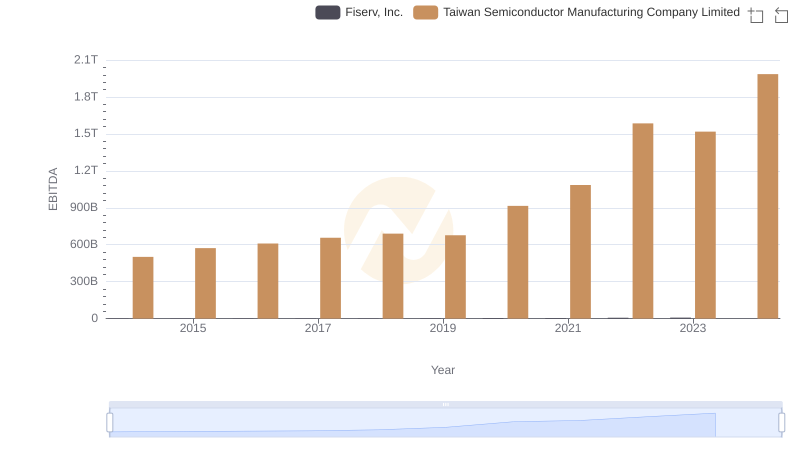
EBITDA Performance Review: Taiwan Semiconductor Manufacturing Company Limited vs Fiserv, Inc.