| __timestamp | Autodesk, Inc. | Shopify Inc. |
|---|---|---|
| Wednesday, January 1, 2014 | 274300000 | 43223000 |
| Thursday, January 1, 2015 | 342100000 | 94162000 |
| Friday, January 1, 2016 | 370700000 | 179835000 |
| Sunday, January 1, 2017 | 341900000 | 293051000 |
| Monday, January 1, 2018 | 303400000 | 476962000 |
| Tuesday, January 1, 2019 | 285900000 | 712530000 |
| Wednesday, January 1, 2020 | 324900000 | 1387971000 |
| Friday, January 1, 2021 | 337100000 | 2130712000 |
| Saturday, January 1, 2022 | 418500000 | 2845745000 |
| Sunday, January 1, 2023 | 480000000 | 3545000000 |
| Monday, January 1, 2024 | 463000000 | 4408000000 |
Data in motion
In the ever-evolving landscape of technology, Shopify Inc. and Autodesk, Inc. stand as titans in their respective domains. Over the past decade, Shopify's cost of revenue has skyrocketed, reflecting its rapid growth and expansion. From a modest 43 million in 2014, Shopify's cost of revenue surged to an impressive 3.5 billion by 2023, marking an exponential increase of over 8,000%. This growth underscores Shopify's aggressive scaling and market penetration strategies.
Conversely, Autodesk, a stalwart in design software, has maintained a more stable trajectory. Starting at 274 million in 2014, its cost of revenue grew to 511 million by 2024, a more measured increase of approximately 86%. This stability highlights Autodesk's consistent market presence and strategic investments in innovation.
While Shopify's data for 2024 remains elusive, the trends from the past decade offer a compelling narrative of growth and resilience in the tech industry.
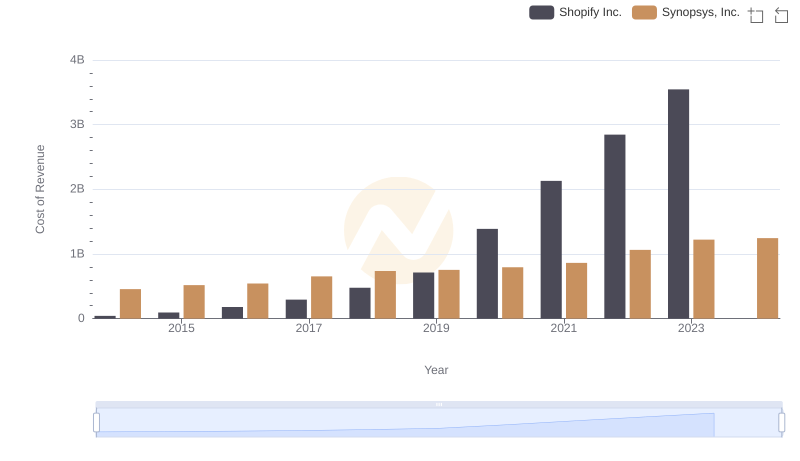
Comparing Cost of Revenue Efficiency: Shopify Inc. vs Synopsys, Inc.
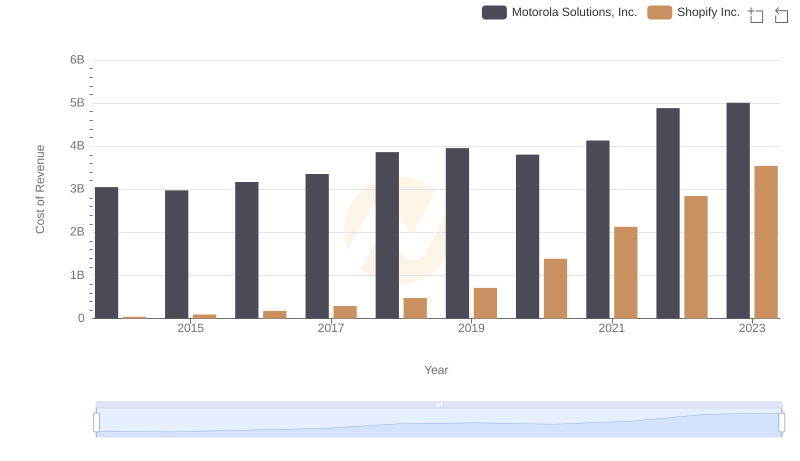
Cost Insights: Breaking Down Shopify Inc. and Motorola Solutions, Inc.'s Expenses
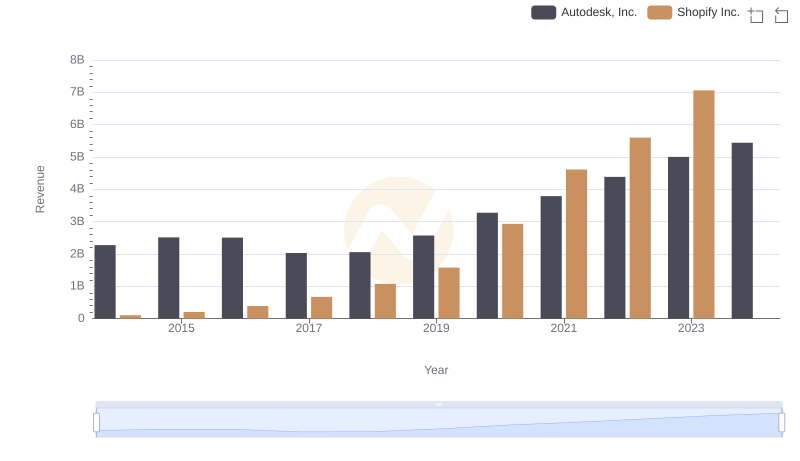
Shopify Inc. and Autodesk, Inc.: A Comprehensive Revenue Analysis
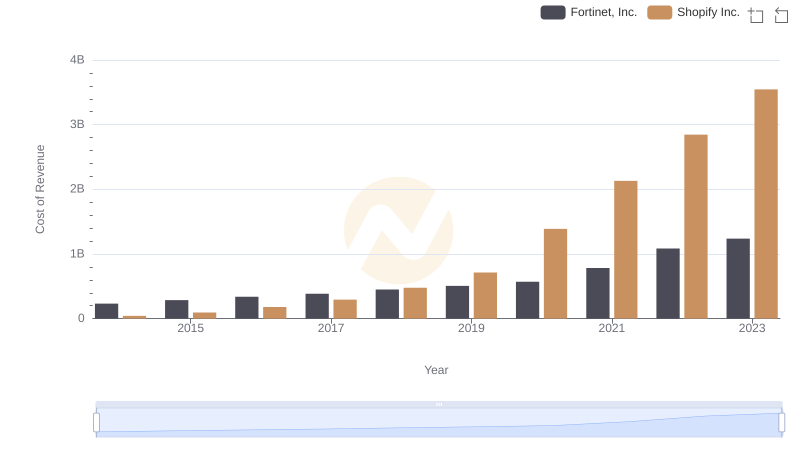
Comparing Cost of Revenue Efficiency: Shopify Inc. vs Fortinet, Inc.
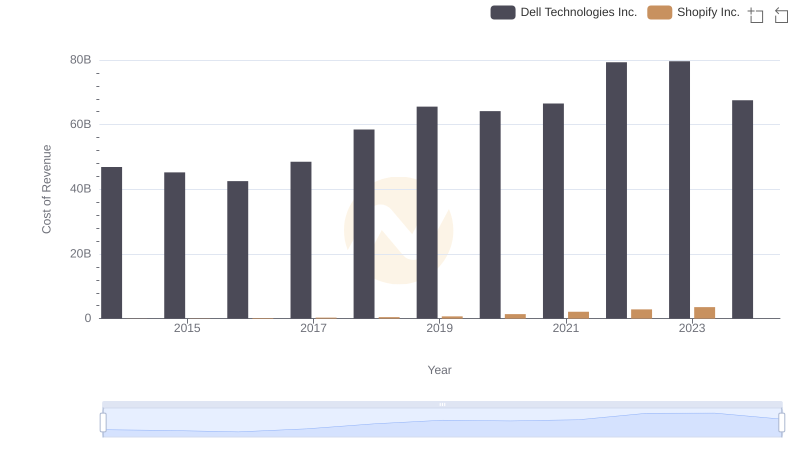
Cost of Revenue: Key Insights for Shopify Inc. and Dell Technologies Inc.
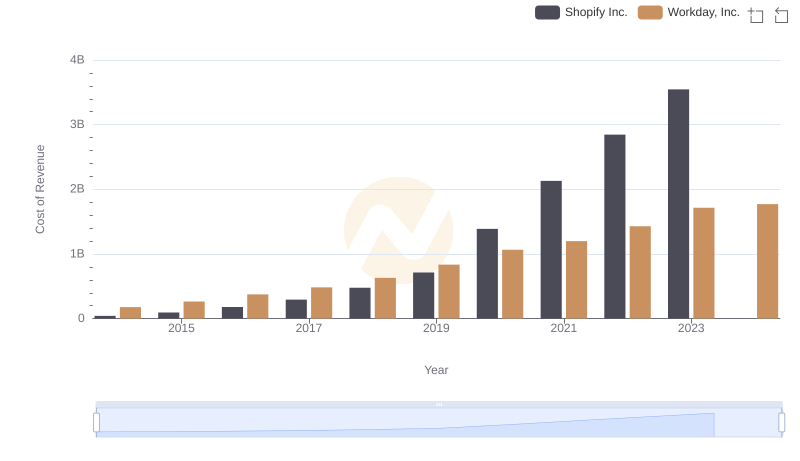
Shopify Inc. vs Workday, Inc.: Efficiency in Cost of Revenue Explored
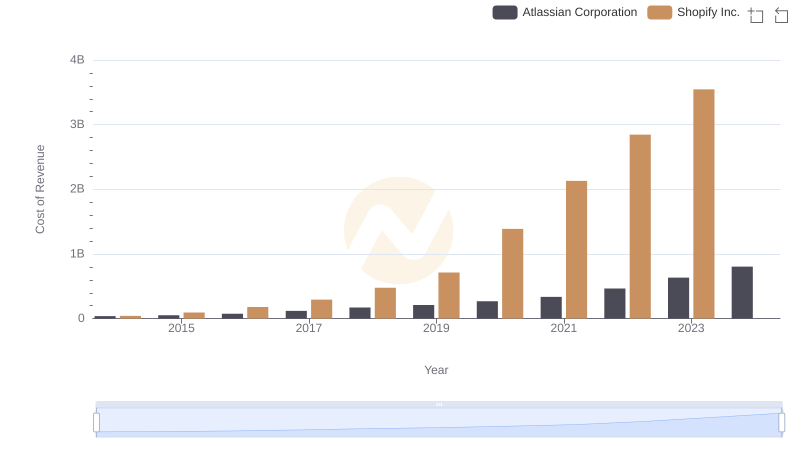
Analyzing Cost of Revenue: Shopify Inc. and Atlassian Corporation
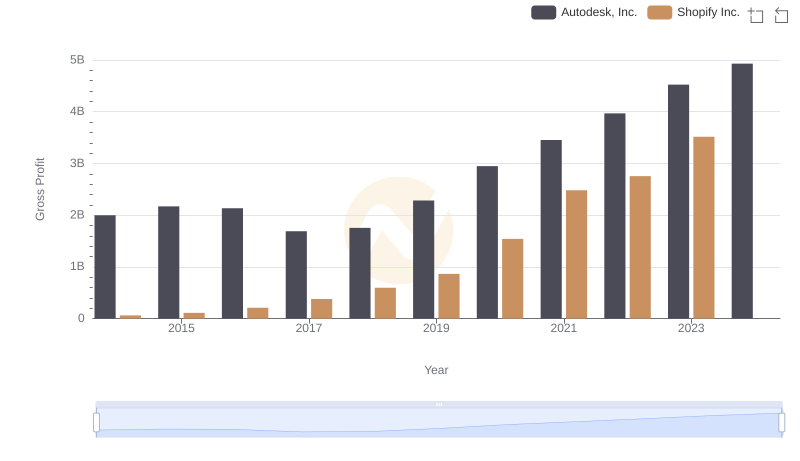
Key Insights on Gross Profit: Shopify Inc. vs Autodesk, Inc.
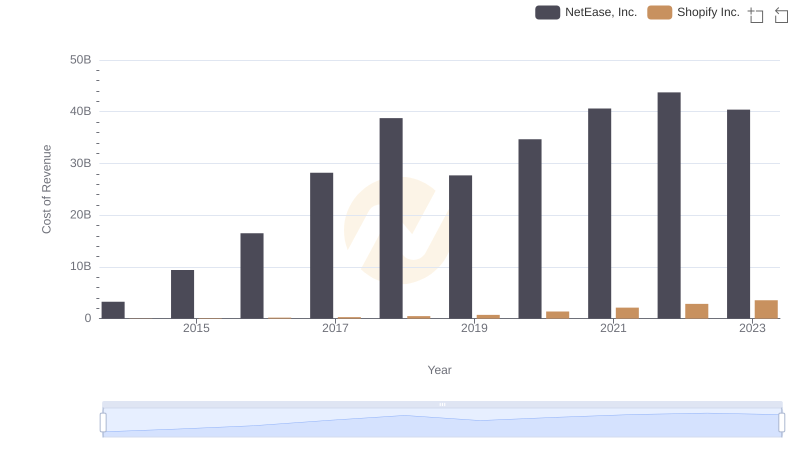
Cost Insights: Breaking Down Shopify Inc. and NetEase, Inc.'s Expenses
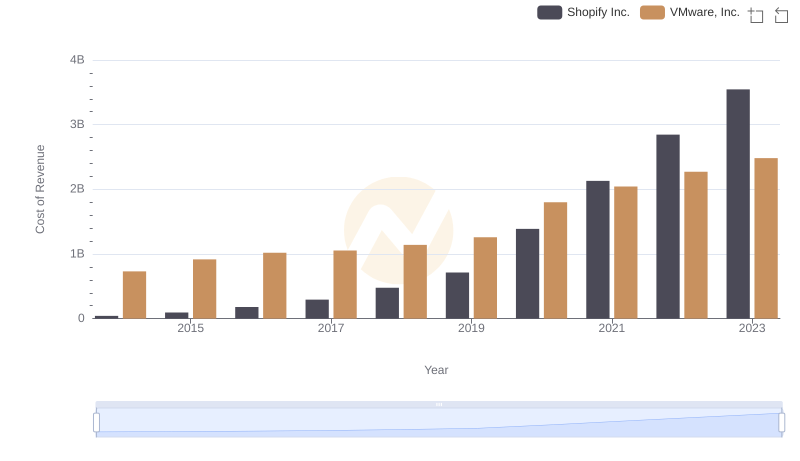
Cost of Revenue: Key Insights for Shopify Inc. and VMware, Inc.
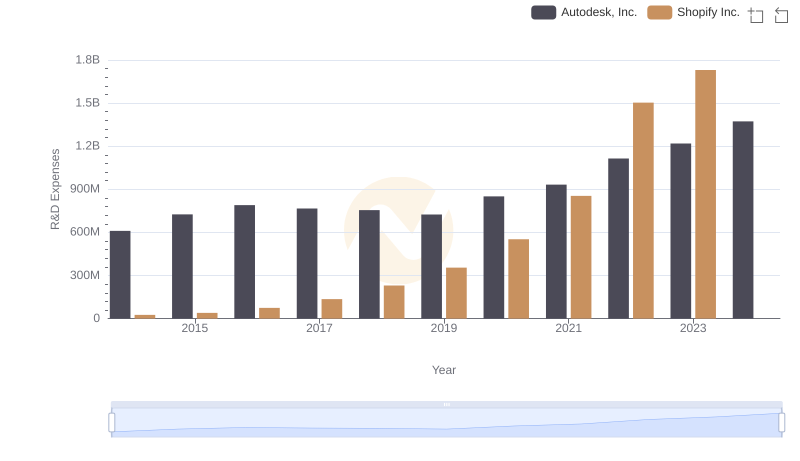
R&D Insights: How Shopify Inc. and Autodesk, Inc. Allocate Funds

Operational Costs Compared: SG&A Analysis of Shopify Inc. and Autodesk, Inc.