| __timestamp | RTX Corporation | Watsco, Inc. |
|---|---|---|
| Wednesday, January 1, 2014 | 47447000000 | 2988138000 |
| Thursday, January 1, 2015 | 40431000000 | 3105882000 |
| Friday, January 1, 2016 | 41460000000 | 3186118000 |
| Sunday, January 1, 2017 | 43953000000 | 3276296000 |
| Monday, January 1, 2018 | 49985000000 | 3426401000 |
| Tuesday, January 1, 2019 | 57065000000 | 3613406000 |
| Wednesday, January 1, 2020 | 48056000000 | 3832107000 |
| Friday, January 1, 2021 | 51897000000 | 4612647000 |
| Saturday, January 1, 2022 | 53406000000 | 5244055000 |
| Sunday, January 1, 2023 | 56831000000 | 5291627000 |
| Monday, January 1, 2024 | 65328000000 | 5573604000 |
Igniting the spark of knowledge
In the ever-evolving landscape of American industry, RTX Corporation and Watsco, Inc. stand as titans in their respective fields. Over the past decade, from 2014 to 2023, RTX Corporation has consistently outpaced Watsco, Inc. in terms of cost of revenue, reflecting its expansive operations and market reach. RTX's cost of revenue surged by approximately 38% from 2014 to 2023, peaking at an impressive $65 billion in 2023. In contrast, Watsco, Inc. experienced a steady growth of around 77% over the same period, reaching nearly $5.3 billion in 2023. This comparison highlights the scale and operational dynamics of these two industry leaders. While RTX's figures dwarf those of Watsco, the latter's growth trajectory is noteworthy, showcasing its resilience and strategic market positioning. The data for 2024 remains incomplete, leaving room for speculation on future trends.
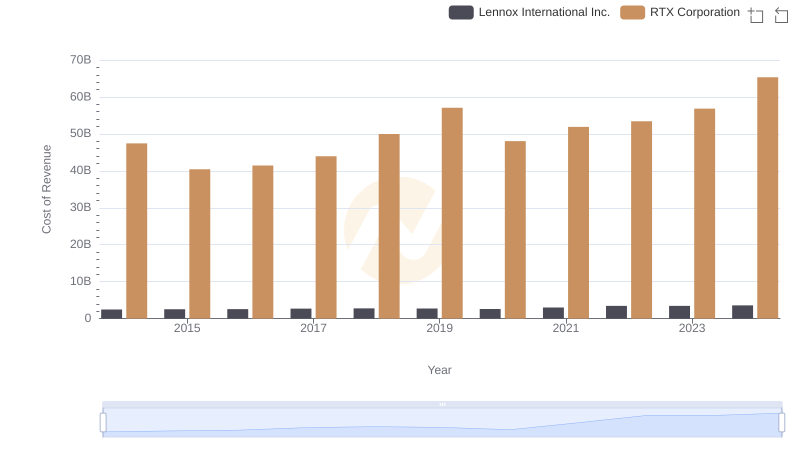
RTX Corporation vs Lennox International Inc.: Efficiency in Cost of Revenue Explored
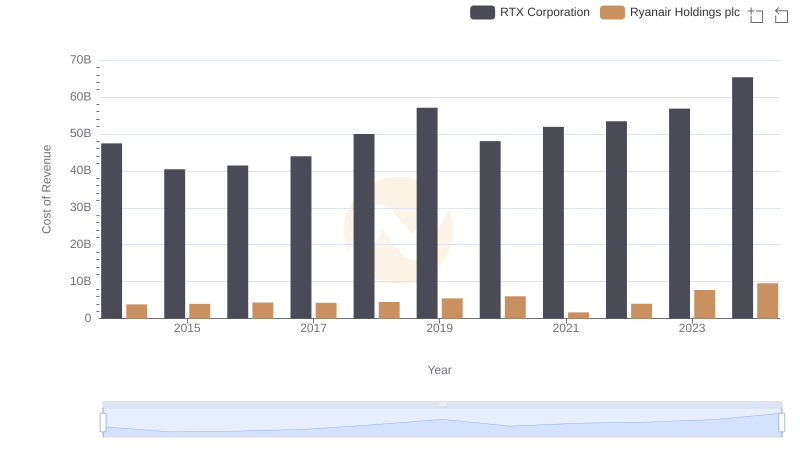
Cost of Revenue: Key Insights for RTX Corporation and Ryanair Holdings plc
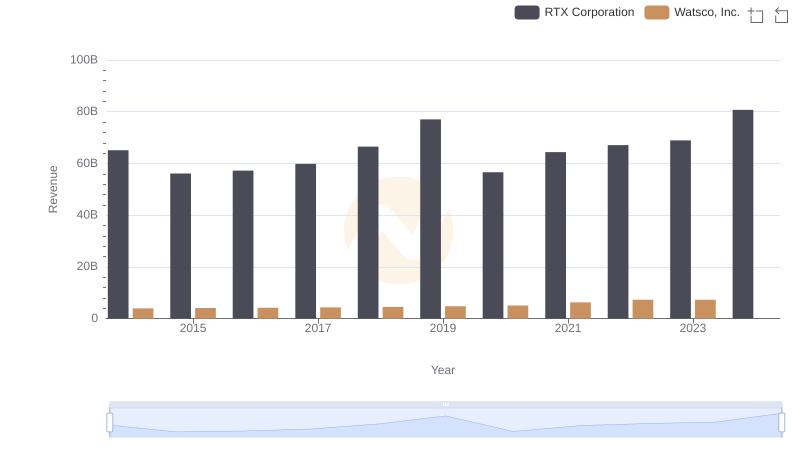
RTX Corporation vs Watsco, Inc.: Examining Key Revenue Metrics
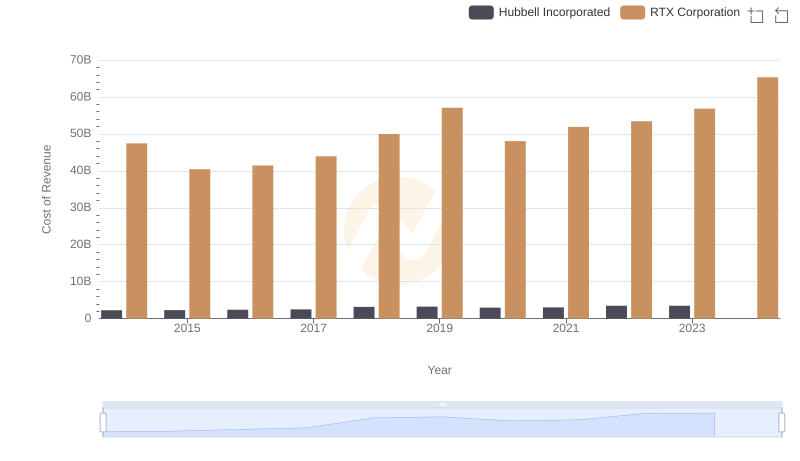
Cost of Revenue Comparison: RTX Corporation vs Hubbell Incorporated
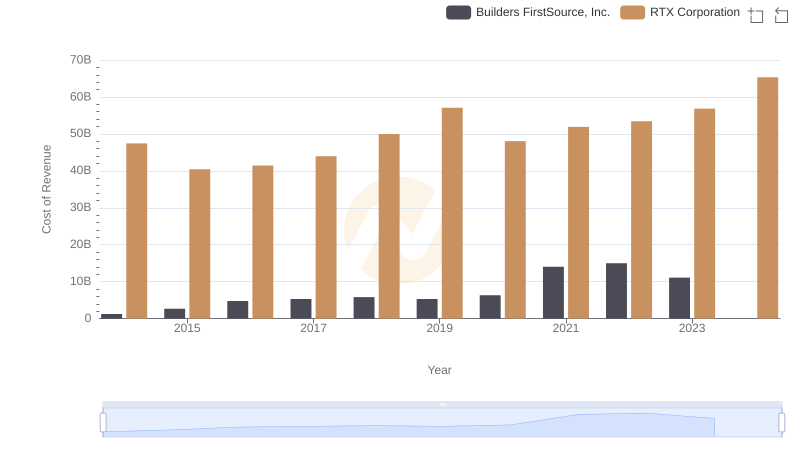
Cost Insights: Breaking Down RTX Corporation and Builders FirstSource, Inc.'s Expenses
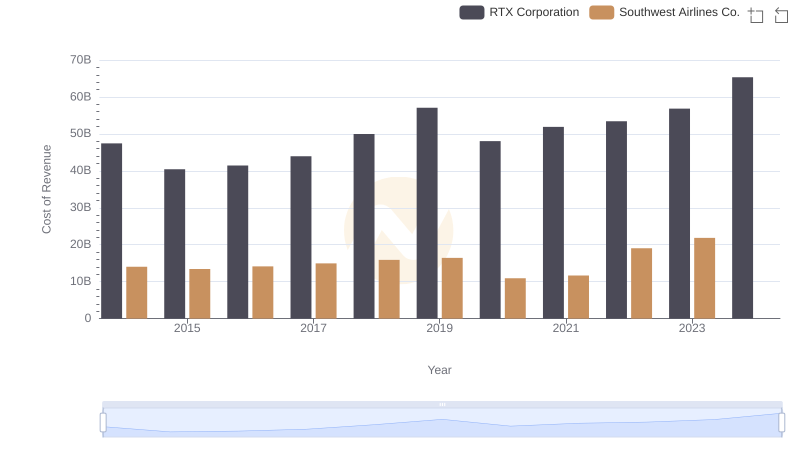
Comparing Cost of Revenue Efficiency: RTX Corporation vs Southwest Airlines Co.
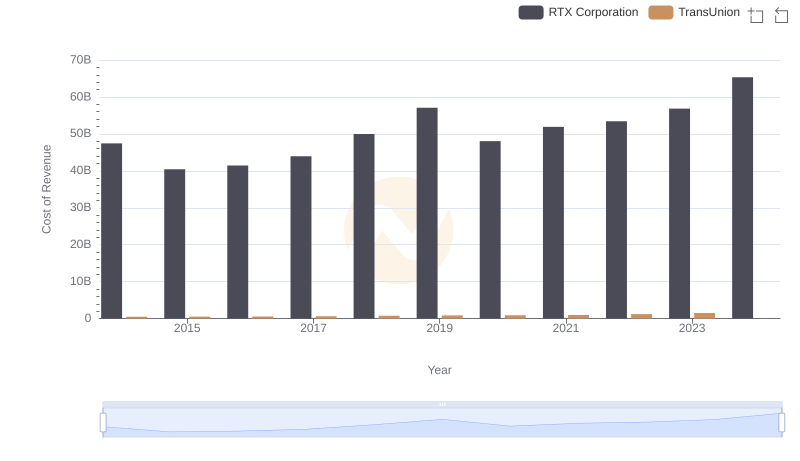
Comparing Cost of Revenue Efficiency: RTX Corporation vs TransUnion
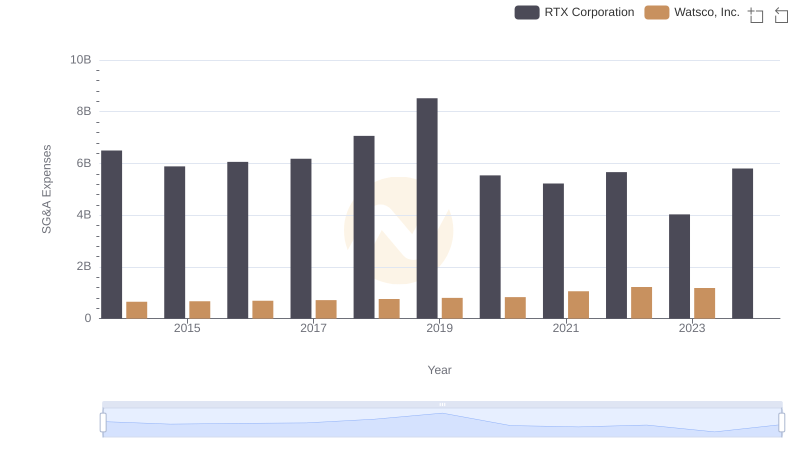
RTX Corporation and Watsco, Inc.: SG&A Spending Patterns Compared

Comprehensive EBITDA Comparison: RTX Corporation vs Watsco, Inc.