| __timestamp | CGI Inc. | Guidewire Software, Inc. |
|---|---|---|
| Wednesday, January 1, 2014 | 8263306000 | 148947000 |
| Thursday, January 1, 2015 | 7980185000 | 147184000 |
| Friday, January 1, 2016 | 8293407000 | 151834000 |
| Sunday, January 1, 2017 | 8500825000 | 191559000 |
| Monday, January 1, 2018 | 9045660000 | 296707000 |
| Tuesday, January 1, 2019 | 9471661000 | 324350000 |
| Wednesday, January 1, 2020 | 9420400000 | 338015000 |
| Friday, January 1, 2021 | 9409971000 | 375054000 |
| Saturday, January 1, 2022 | 10048149000 | 460394000 |
| Sunday, January 1, 2023 | 11982421000 | 447130000 |
| Monday, January 1, 2024 | 12259730000 | 397136000 |
Infusing magic into the data realm
In the ever-evolving landscape of the tech industry, understanding cost structures is crucial for investors and analysts alike. This chart offers a fascinating glimpse into the cost of revenue trends for CGI Inc. and Guidewire Software, Inc. over the past decade.
From 2014 to 2024, CGI Inc. has seen a steady increase in its cost of revenue, peaking at approximately $12.3 billion in 2024. This represents a growth of nearly 48% from its 2014 figures. In contrast, Guidewire Software, Inc. has experienced a more modest increase, with its cost of revenue rising by about 167% over the same period, reaching around $397 million in 2024.
The data highlights CGI Inc.'s significant scale compared to Guidewire, with costs consistently over 30 times higher. This disparity underscores the different operational scales and market strategies of these two companies. Investors should consider these trends when evaluating potential growth and profitability.
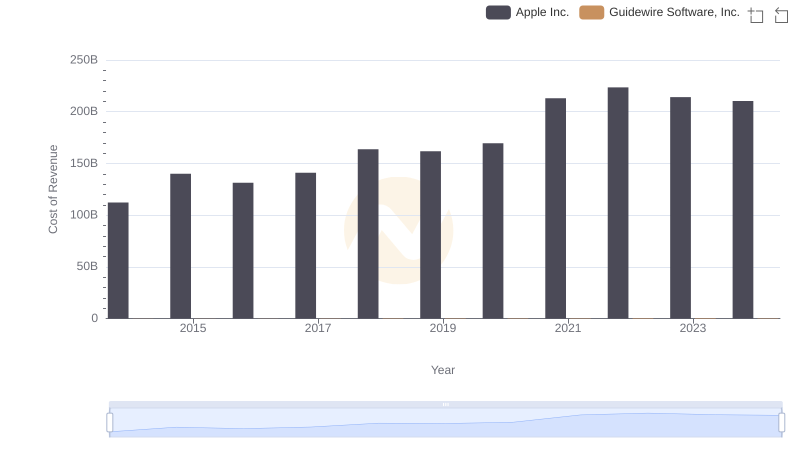
Apple Inc. vs Guidewire Software, Inc.: Efficiency in Cost of Revenue Explored
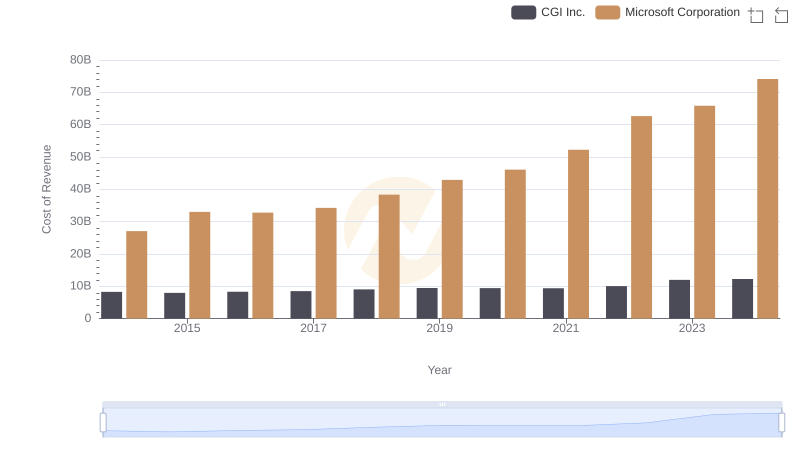
Cost of Revenue: Key Insights for Microsoft Corporation and CGI Inc.
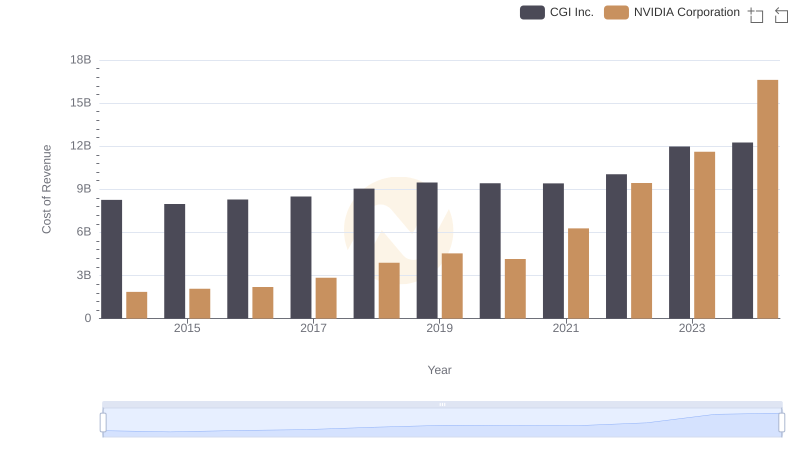
NVIDIA Corporation vs CGI Inc.: Efficiency in Cost of Revenue Explored
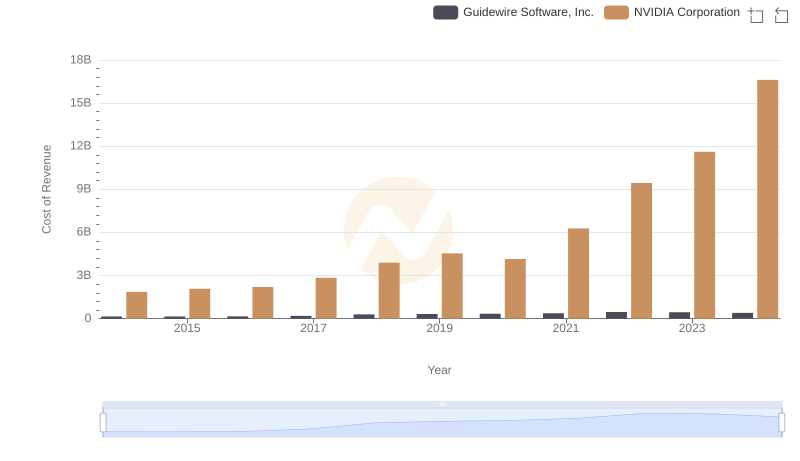
Cost Insights: Breaking Down NVIDIA Corporation and Guidewire Software, Inc.'s Expenses
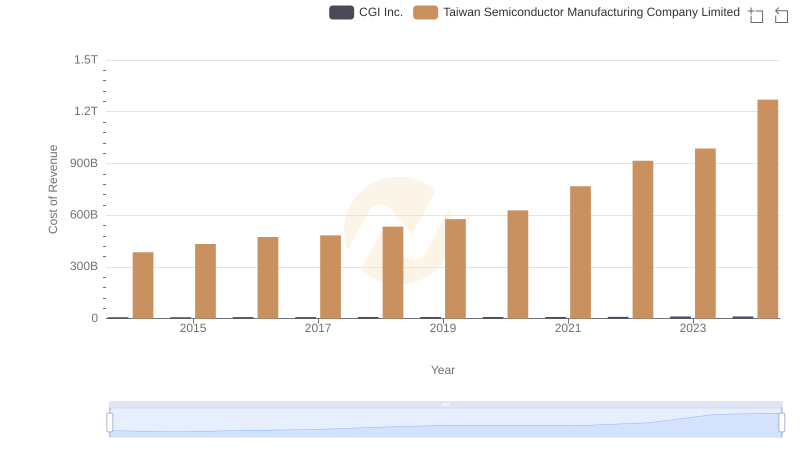
Cost Insights: Breaking Down Taiwan Semiconductor Manufacturing Company Limited and CGI Inc.'s Expenses
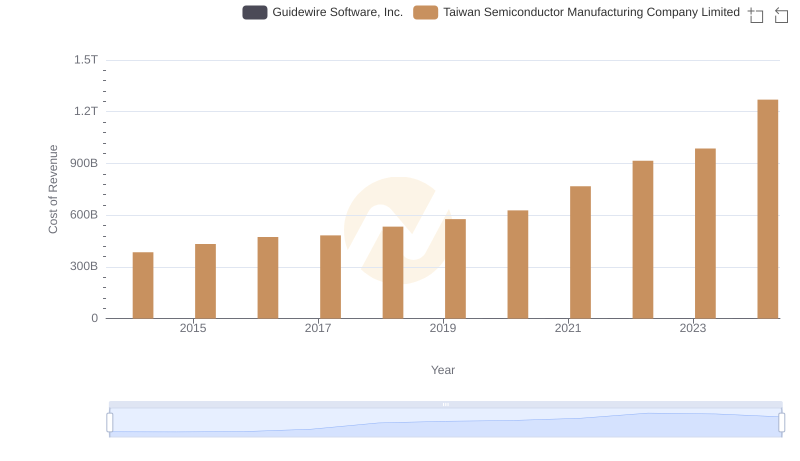
Comparing Cost of Revenue Efficiency: Taiwan Semiconductor Manufacturing Company Limited vs Guidewire Software, Inc.
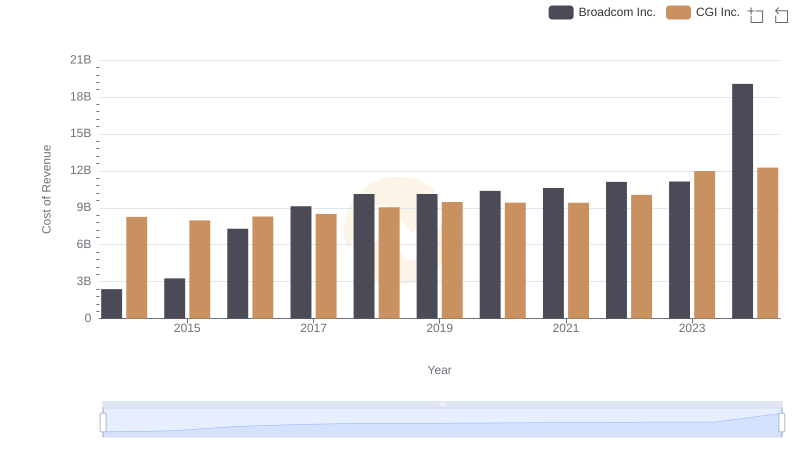
Cost Insights: Breaking Down Broadcom Inc. and CGI Inc.'s Expenses

Cost of Revenue Trends: Broadcom Inc. vs Guidewire Software, Inc.
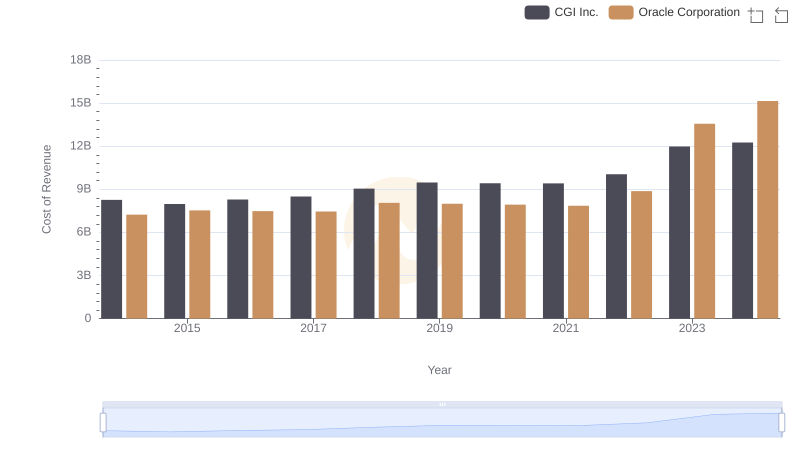
Comparing Cost of Revenue Efficiency: Oracle Corporation vs CGI Inc.
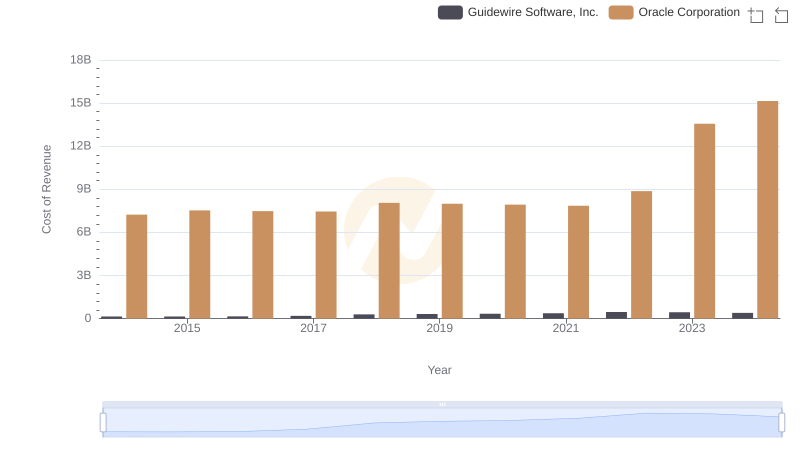
Cost of Revenue Comparison: Oracle Corporation vs Guidewire Software, Inc.
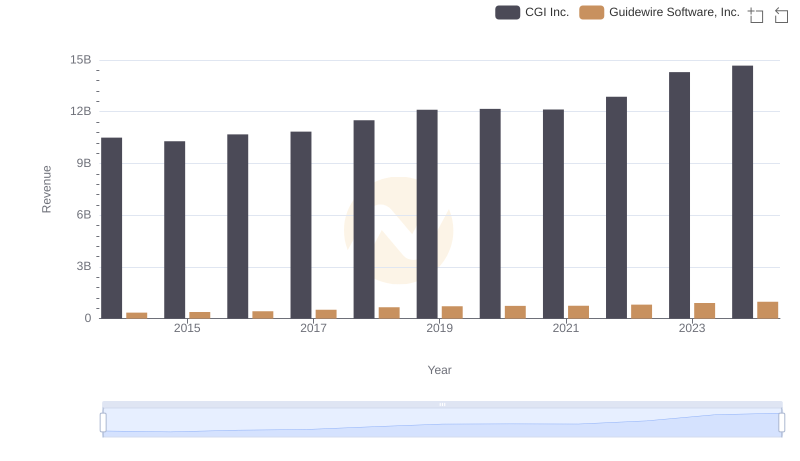
CGI Inc. and Guidewire Software, Inc.: A Comprehensive Revenue Analysis
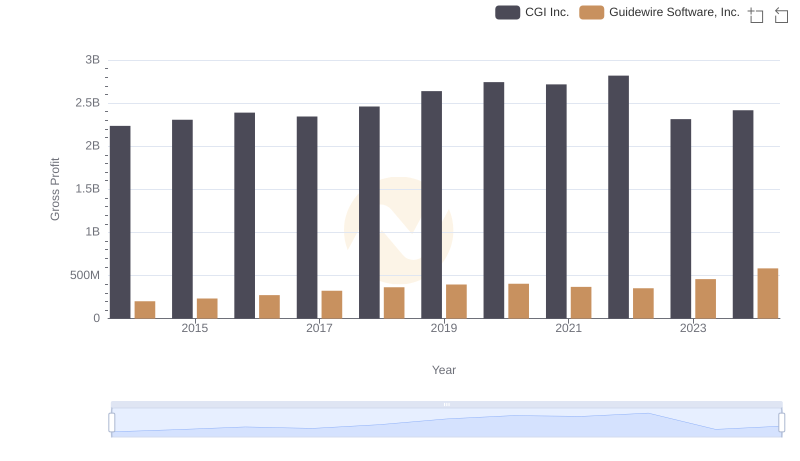
Gross Profit Comparison: CGI Inc. and Guidewire Software, Inc. Trends