| __timestamp | ANSYS, Inc. | Gen Digital Inc. |
|---|---|---|
| Wednesday, January 1, 2014 | 153386000 | 1149000000 |
| Thursday, January 1, 2015 | 147246000 | 1153000000 |
| Friday, January 1, 2016 | 146860000 | 615000000 |
| Sunday, January 1, 2017 | 150164000 | 853000000 |
| Monday, January 1, 2018 | 155885000 | 1032000000 |
| Tuesday, January 1, 2019 | 166273000 | 1050000000 |
| Wednesday, January 1, 2020 | 225264000 | 393000000 |
| Friday, January 1, 2021 | 257984000 | 362000000 |
| Saturday, January 1, 2022 | 250641000 | 408000000 |
| Sunday, January 1, 2023 | 271298000 | 589000000 |
| Monday, January 1, 2024 | 279819000 | 731000000 |
Cracking the code
In the ever-evolving landscape of technology, understanding the financial dynamics of industry leaders is crucial. ANSYS, Inc. and Gen Digital Inc. have been pivotal players, each with unique cost structures. From 2014 to 2023, ANSYS, Inc. maintained a relatively stable cost of revenue, averaging around $192 million annually. However, Gen Digital Inc. exhibited a more volatile pattern, with costs peaking at over $1.1 billion in 2015 before dropping to $362 million in 2021.
This comparison highlights the contrasting financial strategies and market responses of these tech giants over the past decade.
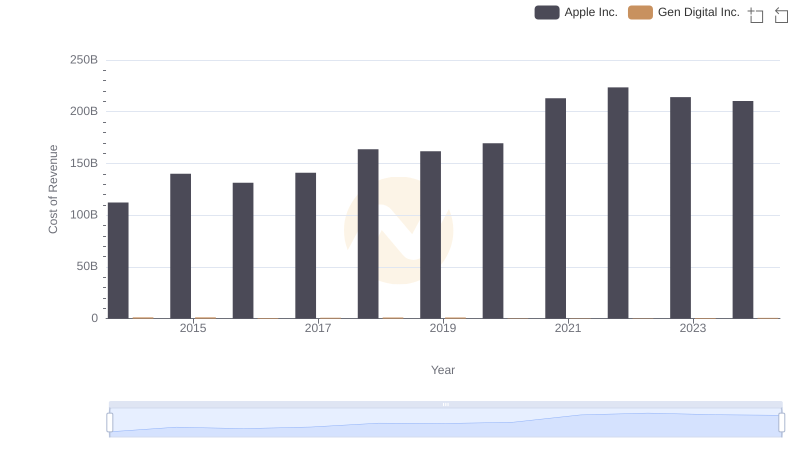
Analyzing Cost of Revenue: Apple Inc. and Gen Digital Inc.
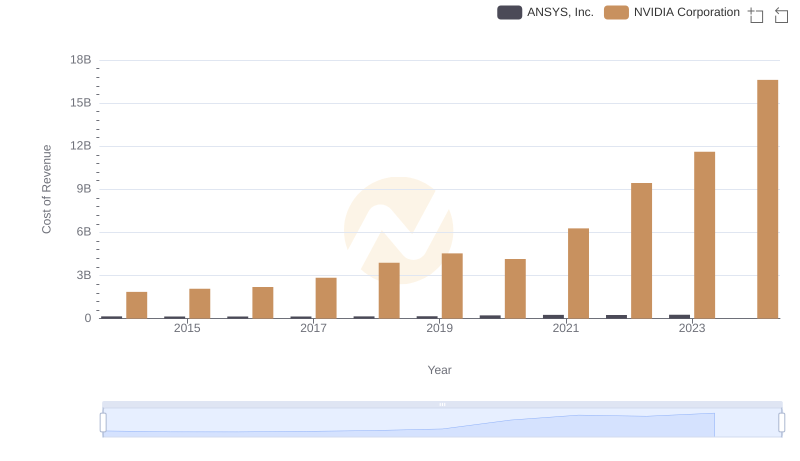
Cost of Revenue: Key Insights for NVIDIA Corporation and ANSYS, Inc.
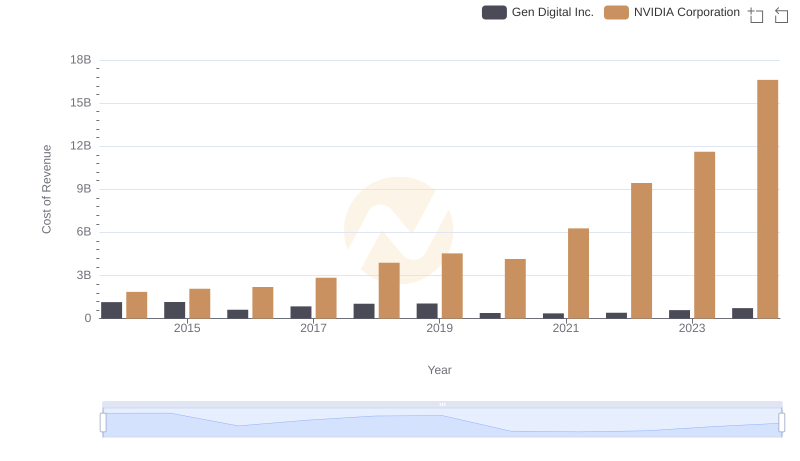
Cost Insights: Breaking Down NVIDIA Corporation and Gen Digital Inc.'s Expenses
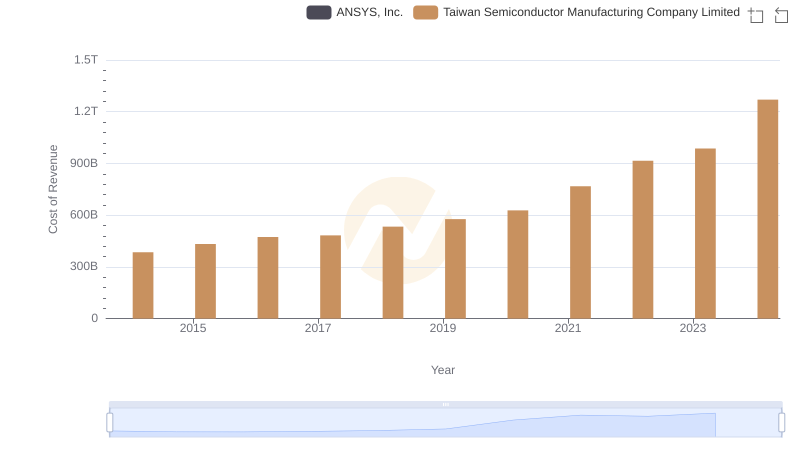
Cost of Revenue Comparison: Taiwan Semiconductor Manufacturing Company Limited vs ANSYS, Inc.
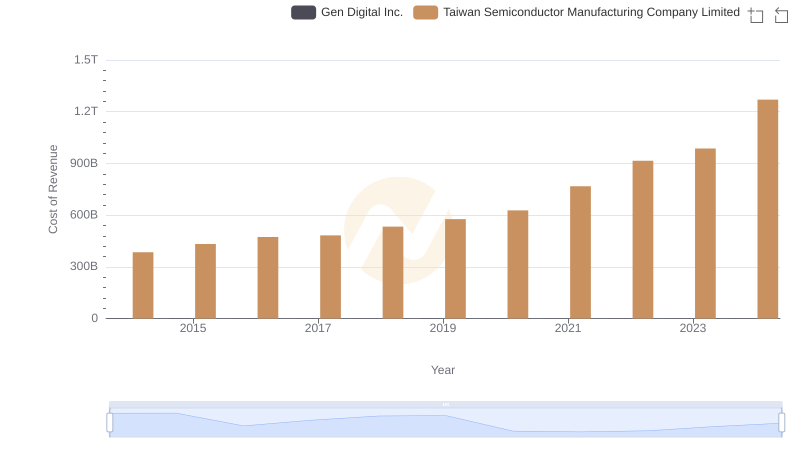
Cost of Revenue Trends: Taiwan Semiconductor Manufacturing Company Limited vs Gen Digital Inc.
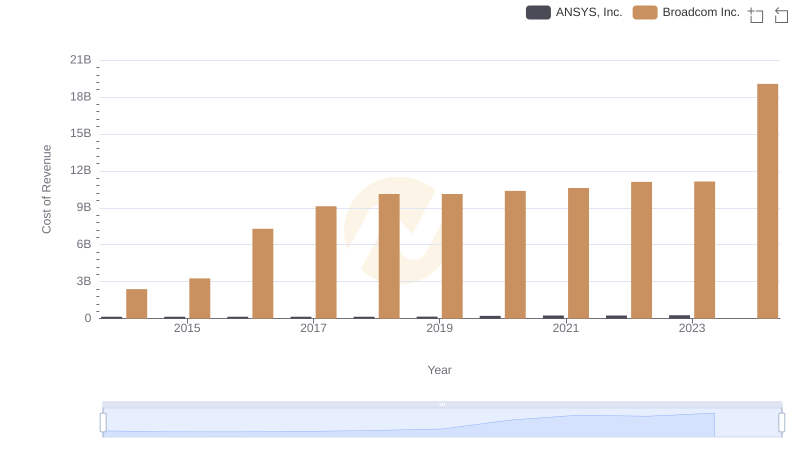
Broadcom Inc. vs ANSYS, Inc.: Efficiency in Cost of Revenue Explored
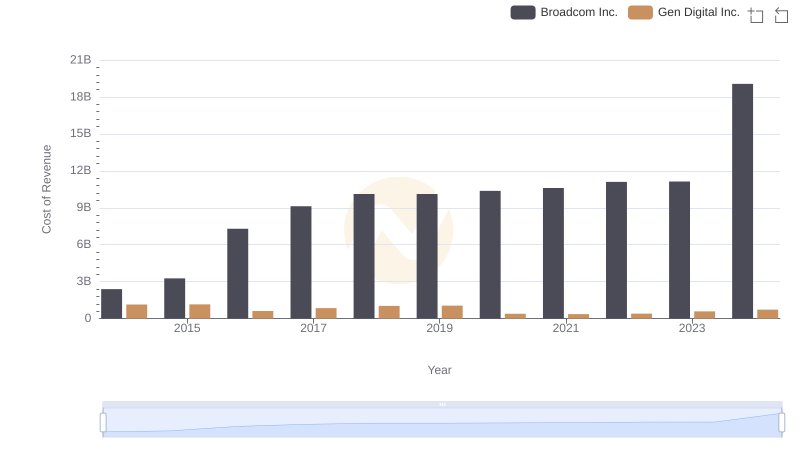
Comparing Cost of Revenue Efficiency: Broadcom Inc. vs Gen Digital Inc.
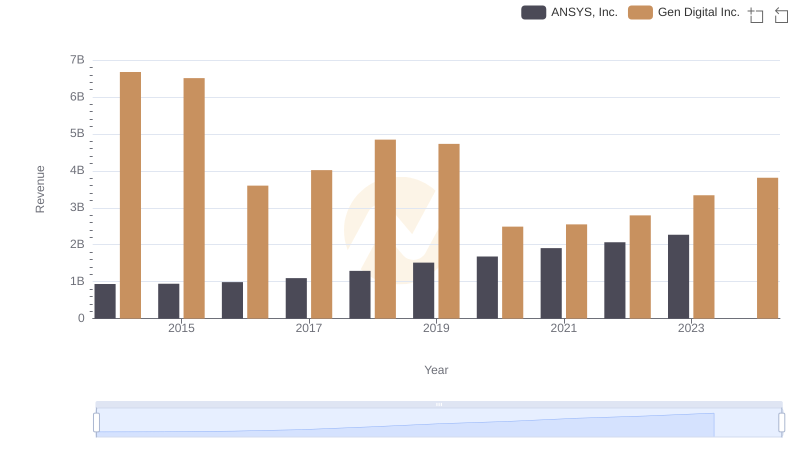
ANSYS, Inc. or Gen Digital Inc.: Who Leads in Yearly Revenue?
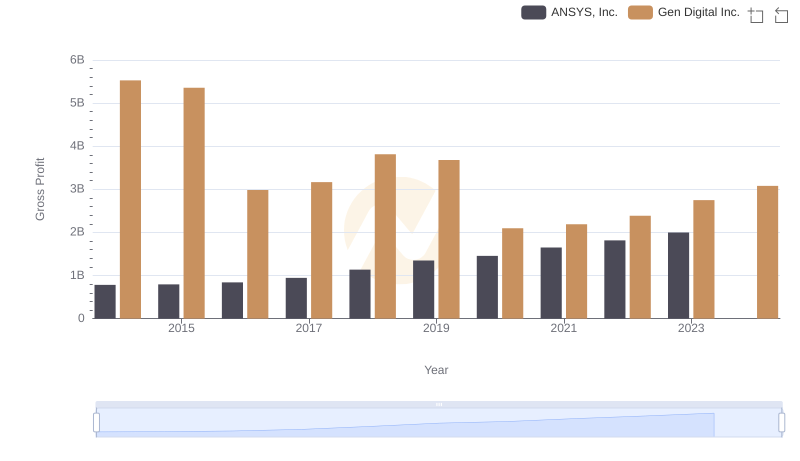
Gross Profit Trends Compared: ANSYS, Inc. vs Gen Digital Inc.
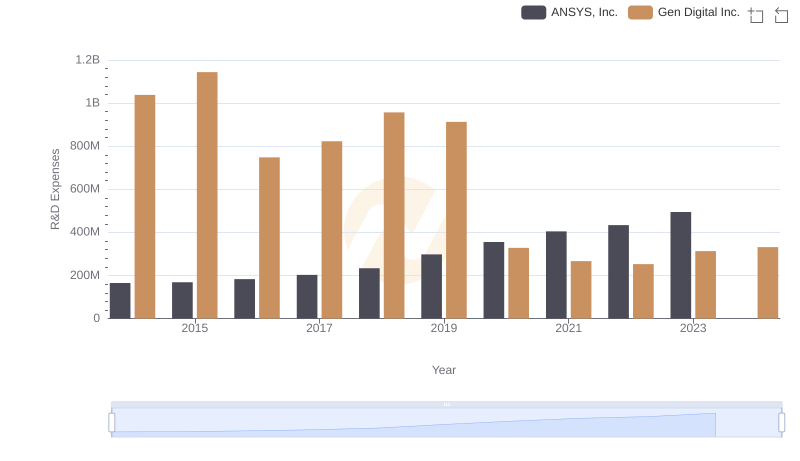
R&D Spending Showdown: ANSYS, Inc. vs Gen Digital Inc.
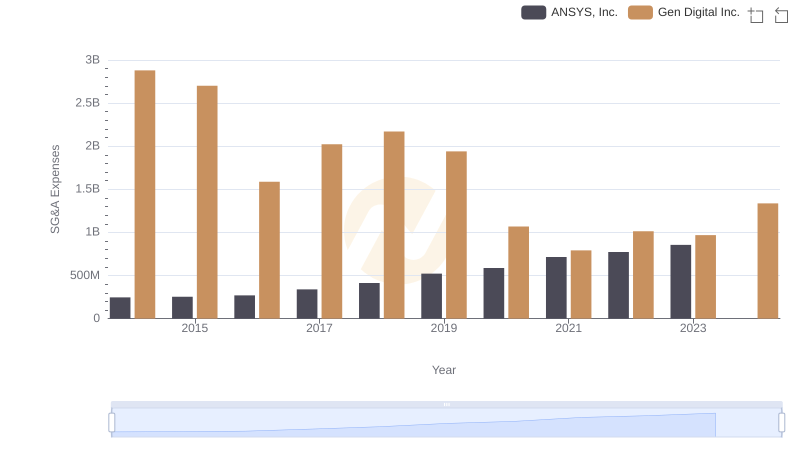
Selling, General, and Administrative Costs: ANSYS, Inc. vs Gen Digital Inc.
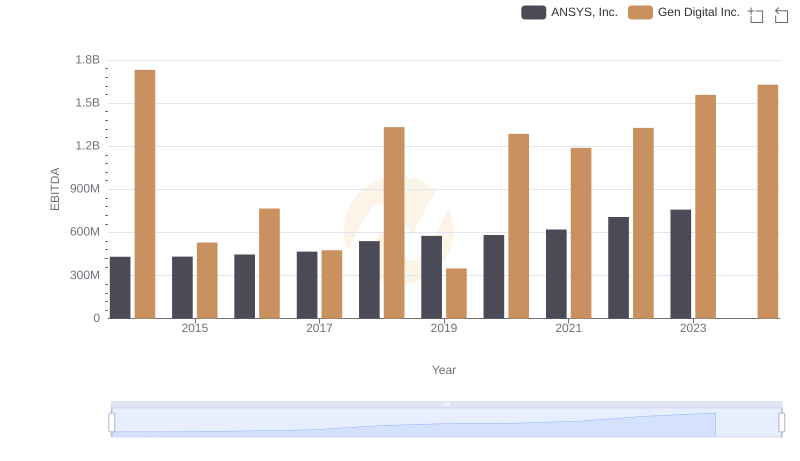
ANSYS, Inc. and Gen Digital Inc.: A Detailed Examination of EBITDA Performance