| __timestamp | ITT Inc. | XPO Logistics, Inc. |
|---|---|---|
| Wednesday, January 1, 2014 | 1788200000 | 1975000000 |
| Thursday, January 1, 2015 | 1676500000 | 6538400000 |
| Friday, January 1, 2016 | 1647200000 | 12480100000 |
| Sunday, January 1, 2017 | 1768100000 | 13101100000 |
| Monday, January 1, 2018 | 1857900000 | 14738000000 |
| Tuesday, January 1, 2019 | 1936300000 | 13982000000 |
| Wednesday, January 1, 2020 | 1695600000 | 13689000000 |
| Friday, January 1, 2021 | 1865500000 | 10812000000 |
| Saturday, January 1, 2022 | 2065400000 | 6491000000 |
| Sunday, January 1, 2023 | 2175700000 | 6974000000 |
| Monday, January 1, 2024 | 2383400000 | 7157000000 |
In pursuit of knowledge
In the ever-evolving landscape of logistics and manufacturing, understanding cost structures is pivotal. From 2014 to 2023, XPO Logistics, Inc. and ITT Inc. have showcased distinct cost trajectories. XPO Logistics, a titan in transportation, saw its cost of revenue peak in 2018, with a staggering 647% increase from 2014. However, by 2022, costs had receded by 56%, reflecting strategic shifts or market dynamics. In contrast, ITT Inc., a leader in engineering solutions, maintained a more stable cost pattern, with a modest 22% rise over the decade. The year 2023 marked ITT's highest cost of revenue, hinting at potential expansions or increased operational demands. This comparative analysis not only highlights the volatility in logistics but also underscores the resilience in engineering sectors. As businesses navigate post-pandemic realities, these insights offer a lens into strategic cost management.
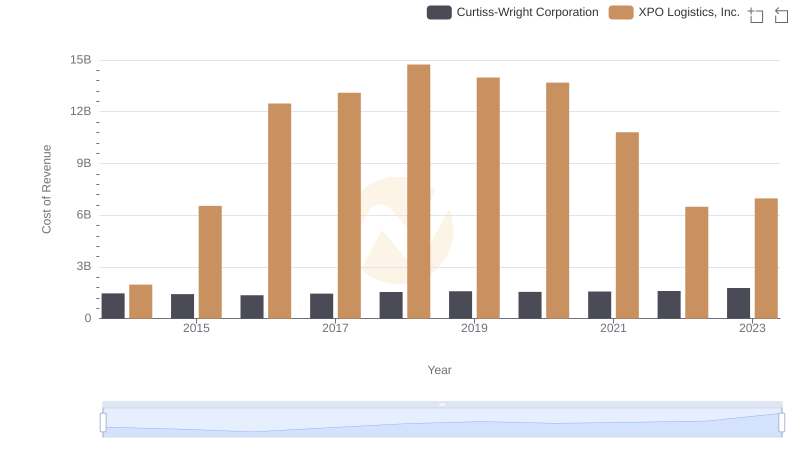
Analyzing Cost of Revenue: XPO Logistics, Inc. and Curtiss-Wright Corporation
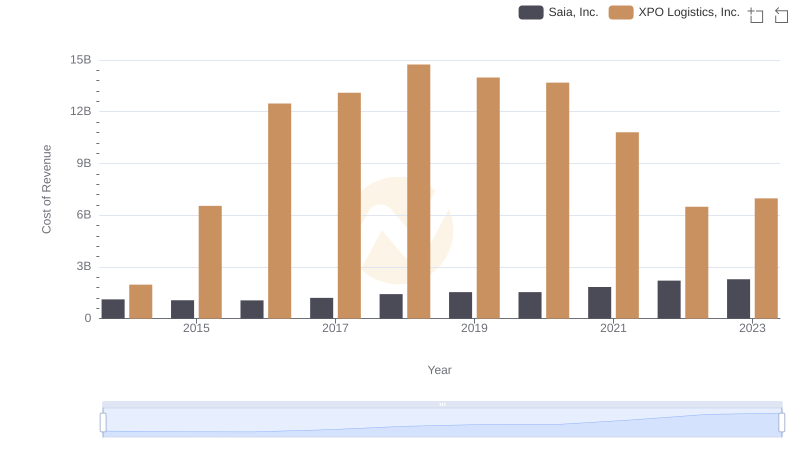
Cost of Revenue Trends: XPO Logistics, Inc. vs Saia, Inc.

Cost of Revenue: Key Insights for XPO Logistics, Inc. and C.H. Robinson Worldwide, Inc.
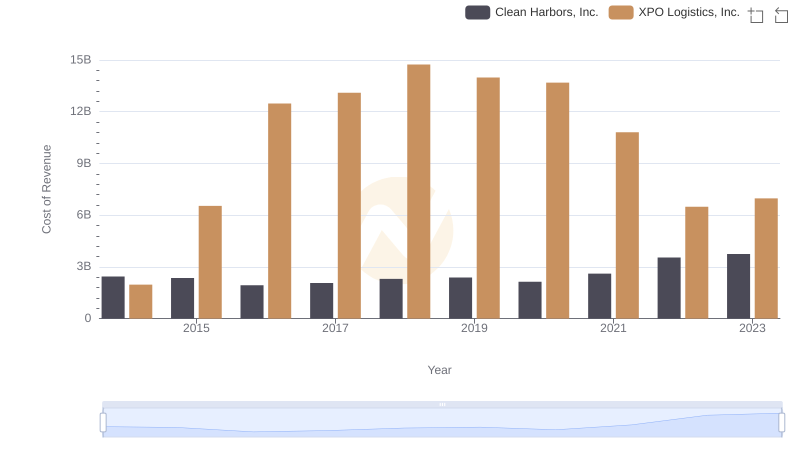
Cost Insights: Breaking Down XPO Logistics, Inc. and Clean Harbors, Inc.'s Expenses
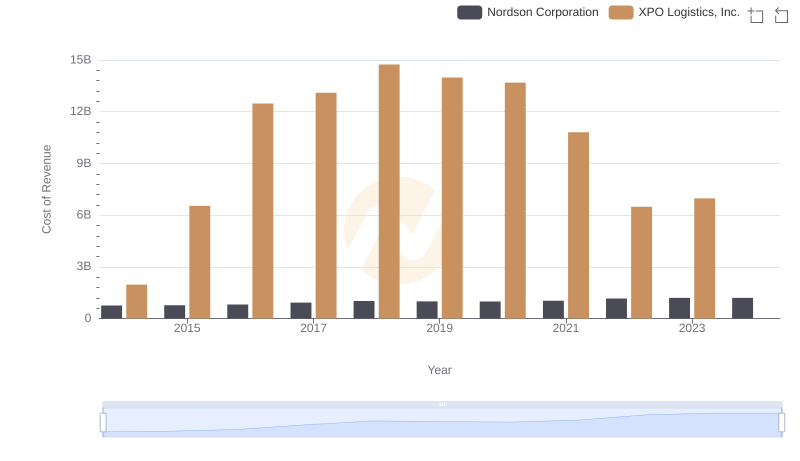
Analyzing Cost of Revenue: XPO Logistics, Inc. and Nordson Corporation
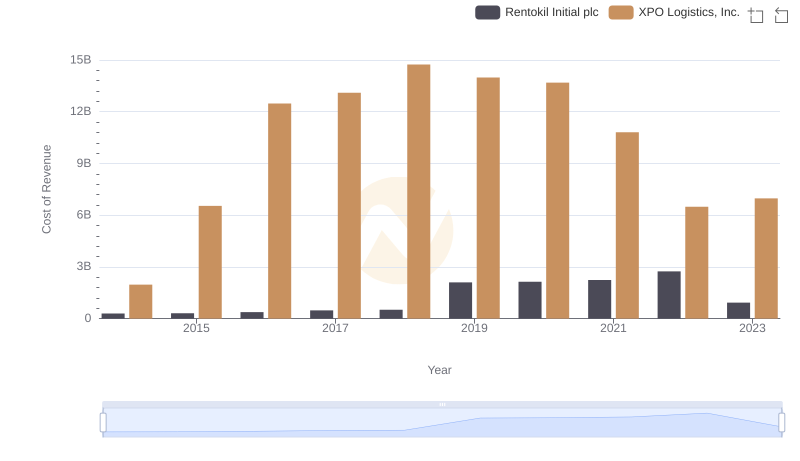
Analyzing Cost of Revenue: XPO Logistics, Inc. and Rentokil Initial plc
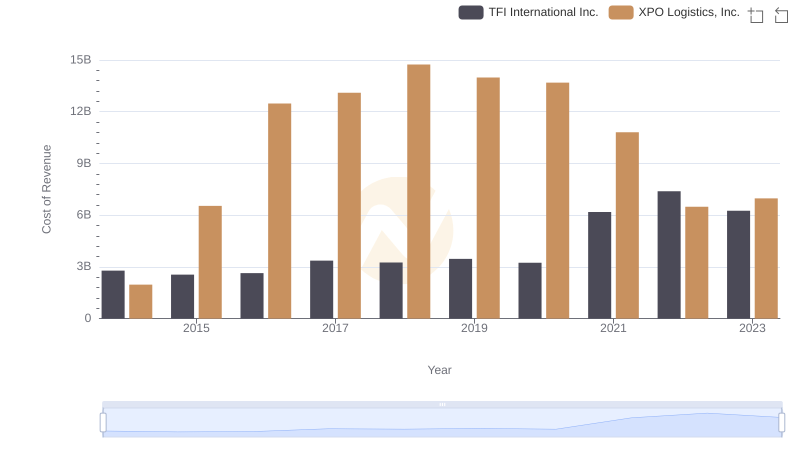
Cost of Revenue: Key Insights for XPO Logistics, Inc. and TFI International Inc.
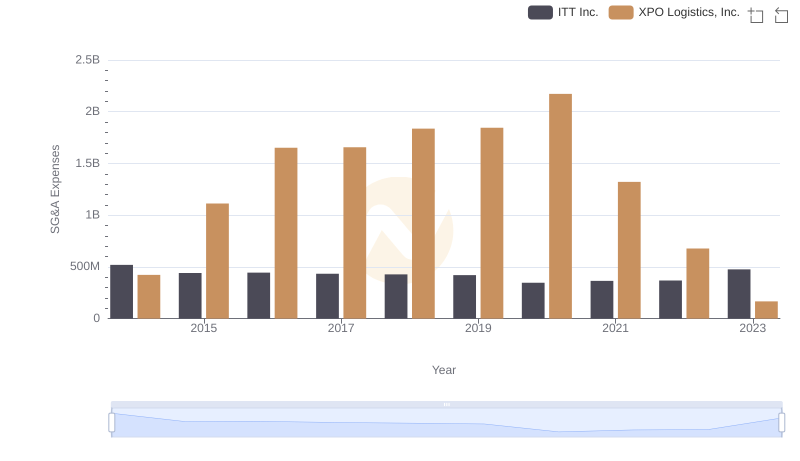
Operational Costs Compared: SG&A Analysis of XPO Logistics, Inc. and ITT Inc.

EBITDA Performance Review: XPO Logistics, Inc. vs ITT Inc.