| __timestamp | Shopify Inc. | Teradyne, Inc. |
|---|---|---|
| Wednesday, January 1, 2014 | 43223000 | 769016000 |
| Thursday, January 1, 2015 | 94162000 | 723935000 |
| Friday, January 1, 2016 | 179835000 | 793683000 |
| Sunday, January 1, 2017 | 293051000 | 912734000 |
| Monday, January 1, 2018 | 476962000 | 880408000 |
| Tuesday, January 1, 2019 | 712530000 | 955136000 |
| Wednesday, January 1, 2020 | 1387971000 | 1335728000 |
| Friday, January 1, 2021 | 2130712000 | 1496225000 |
| Saturday, January 1, 2022 | 2845745000 | 1287894000 |
| Sunday, January 1, 2023 | 3545000000 | 1139550000 |
| Monday, January 1, 2024 | 4408000000 | 1170953000 |
Infusing magic into the data realm
In the ever-evolving landscape of technology and e-commerce, understanding cost structures is crucial. Shopify Inc., a leader in e-commerce solutions, and Teradyne, Inc., a pioneer in industrial automation, offer intriguing insights into their financial strategies over the past decade. From 2014 to 2023, Shopify's cost of revenue surged by an astounding 8,100%, reflecting its rapid expansion and investment in infrastructure. In contrast, Teradyne's costs grew by a modest 48%, indicating a more stable growth trajectory.
These trends highlight the distinct paths these companies have taken, offering valuable lessons in scaling and sustainability.
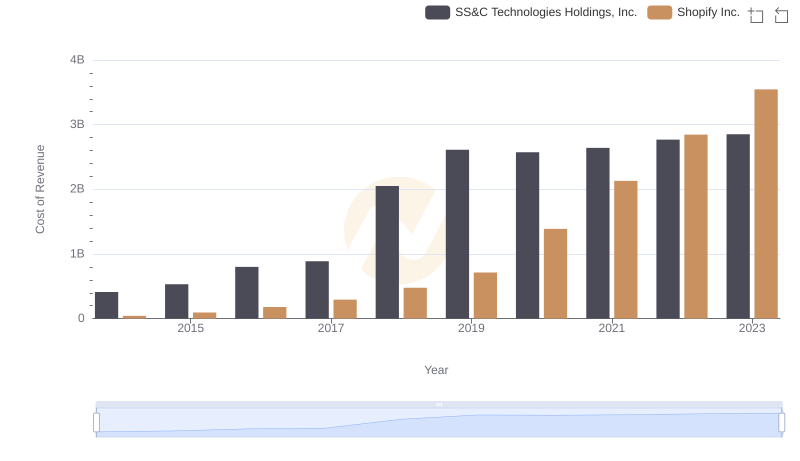
Cost of Revenue: Key Insights for Shopify Inc. and SS&C Technologies Holdings, Inc.
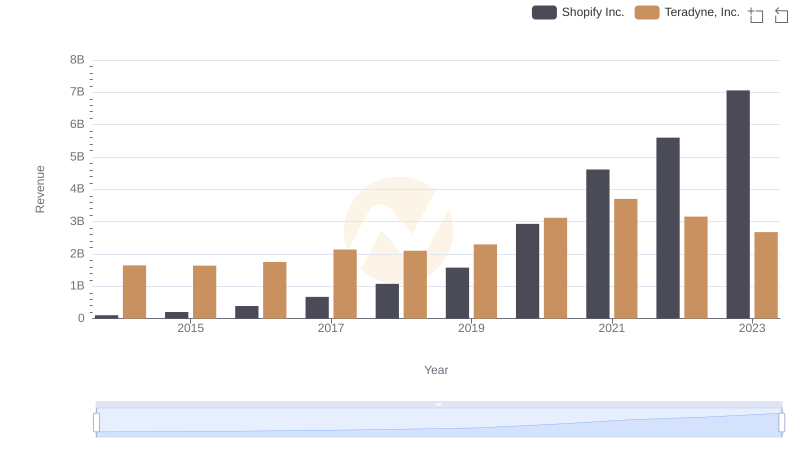
Comparing Revenue Performance: Shopify Inc. or Teradyne, Inc.?
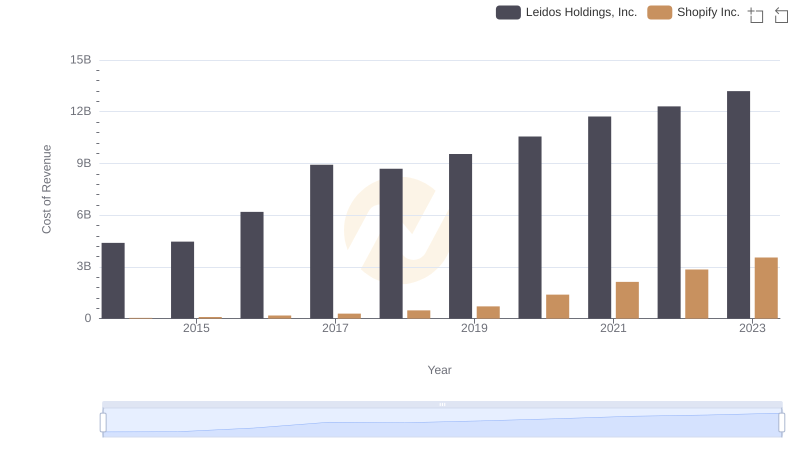
Analyzing Cost of Revenue: Shopify Inc. and Leidos Holdings, Inc.
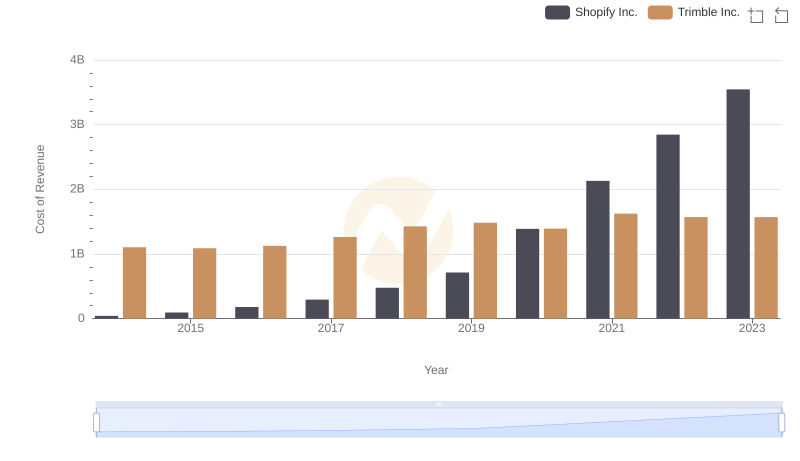
Analyzing Cost of Revenue: Shopify Inc. and Trimble Inc.
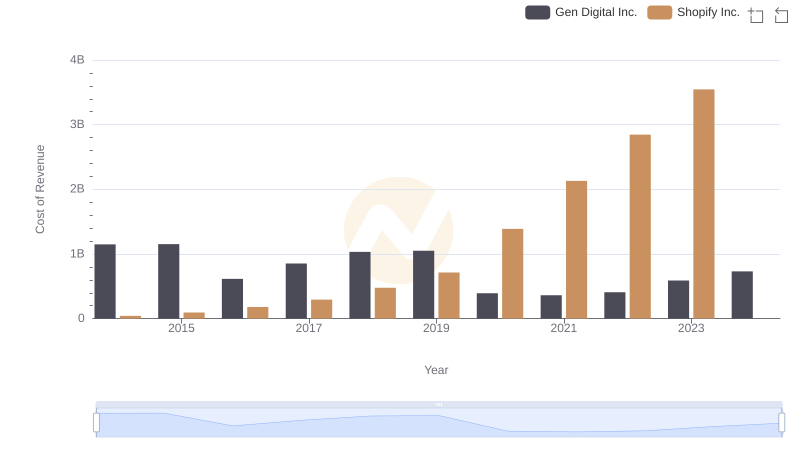
Cost Insights: Breaking Down Shopify Inc. and Gen Digital Inc.'s Expenses
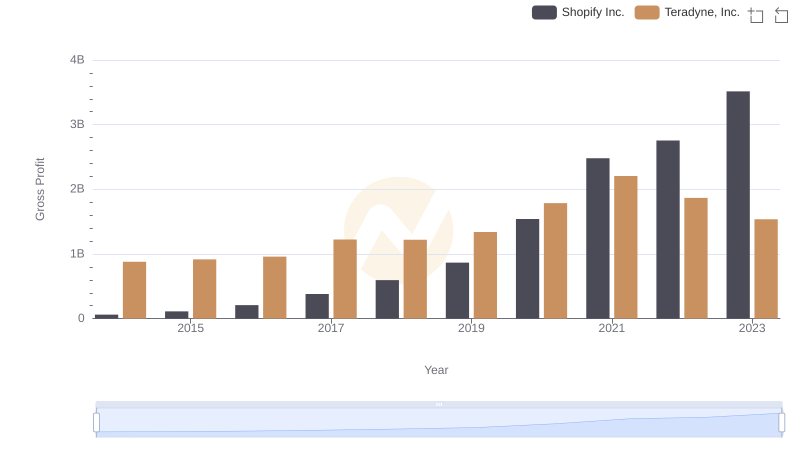
Who Generates Higher Gross Profit? Shopify Inc. or Teradyne, Inc.
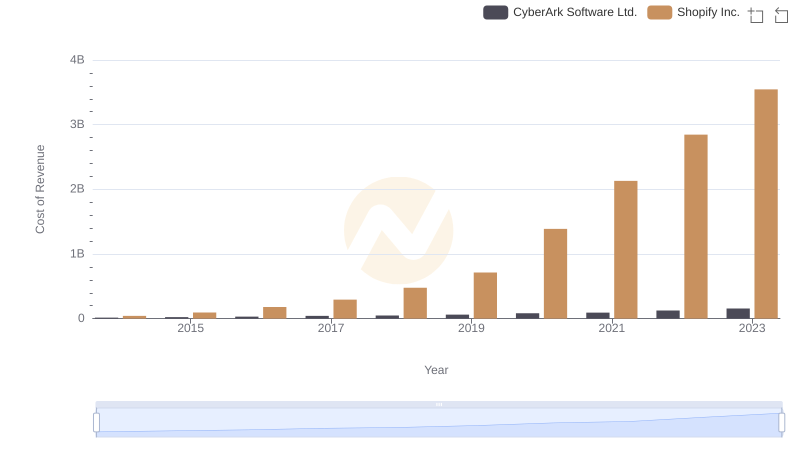
Shopify Inc. vs CyberArk Software Ltd.: Efficiency in Cost of Revenue Explored
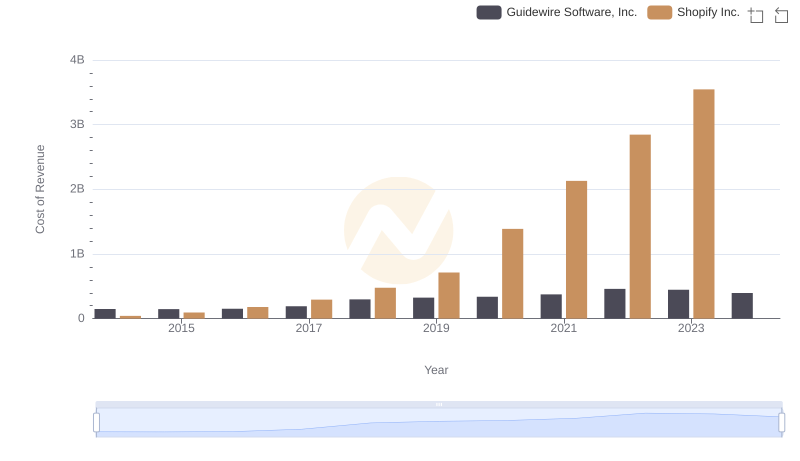
Shopify Inc. vs Guidewire Software, Inc.: Efficiency in Cost of Revenue Explored
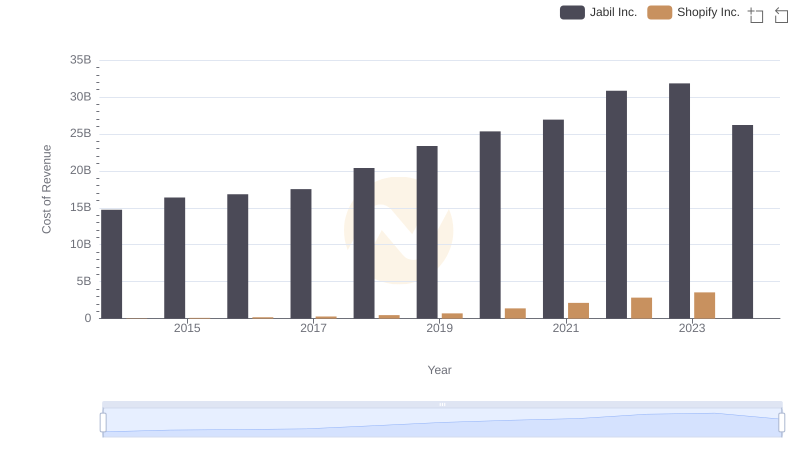
Analyzing Cost of Revenue: Shopify Inc. and Jabil Inc.
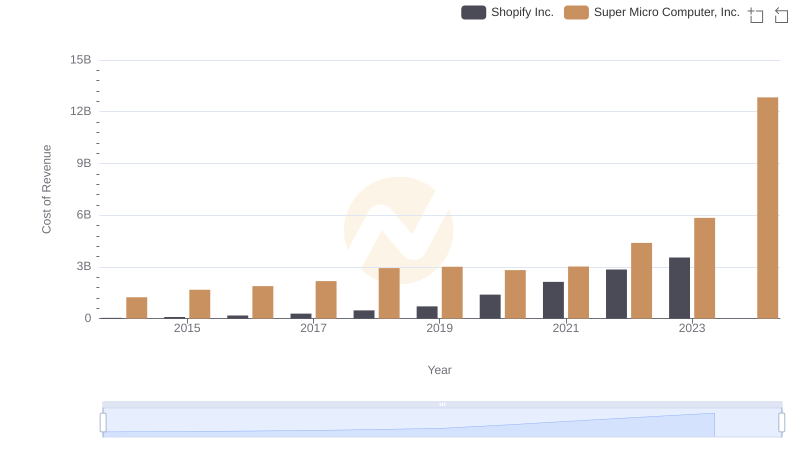
Comparing Cost of Revenue Efficiency: Shopify Inc. vs Super Micro Computer, Inc.
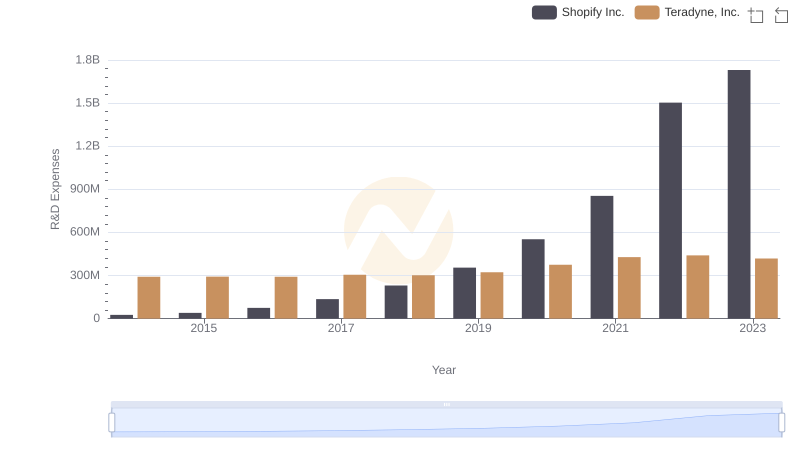
R&D Spending Showdown: Shopify Inc. vs Teradyne, Inc.
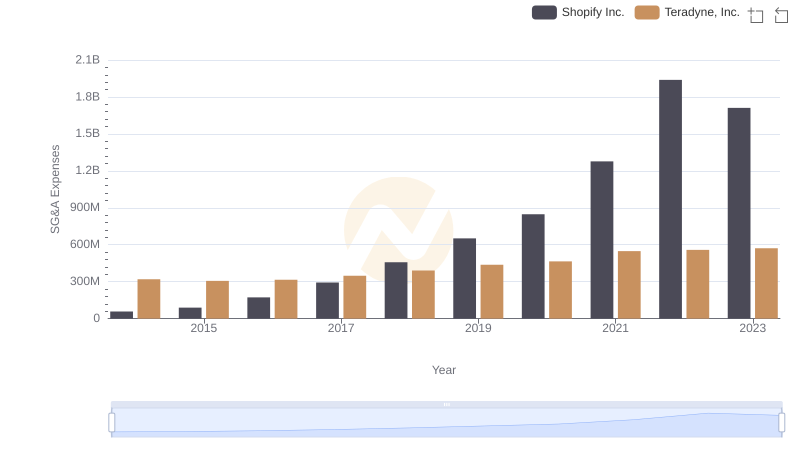
Shopify Inc. and Teradyne, Inc.: SG&A Spending Patterns Compared