| __timestamp | RTX Corporation | U-Haul Holding Company |
|---|---|---|
| Wednesday, January 1, 2014 | 47447000000 | 127270000 |
| Thursday, January 1, 2015 | 40431000000 | 146072000 |
| Friday, January 1, 2016 | 41460000000 | 144990000 |
| Sunday, January 1, 2017 | 43953000000 | 152485000 |
| Monday, January 1, 2018 | 49985000000 | 160489000 |
| Tuesday, January 1, 2019 | 57065000000 | 162142000 |
| Wednesday, January 1, 2020 | 48056000000 | 164018000 |
| Friday, January 1, 2021 | 51897000000 | 214059000 |
| Saturday, January 1, 2022 | 53406000000 | 259585000 |
| Sunday, January 1, 2023 | 56831000000 | 844894000 |
| Monday, January 1, 2024 | 65328000000 | 3976040000 |
Unlocking the unknown
Over the past decade, RTX Corporation and U-Haul Holding Company have showcased distinct financial trajectories in their cost structures. RTX Corporation, a leader in aerospace and defense, has seen its cost of revenue grow by approximately 38% from 2014 to 2024. This increase reflects the company's strategic investments and expansion in a competitive industry. In contrast, U-Haul Holding Company, a stalwart in the moving and storage sector, experienced a staggering 3,000% rise in its cost of revenue over the same period, indicating significant scaling and operational expansion.
While RTX's costs have steadily increased, U-Haul's dramatic rise in expenses suggests a transformative phase, possibly driven by increased demand for moving services. This divergence highlights the unique challenges and opportunities each company faces in their respective markets. As we look to the future, understanding these cost dynamics will be crucial for investors and industry analysts alike.
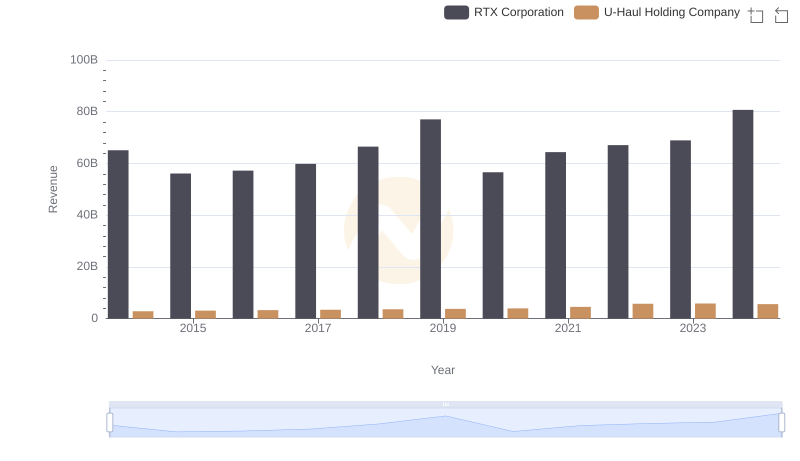
RTX Corporation and U-Haul Holding Company: A Comprehensive Revenue Analysis
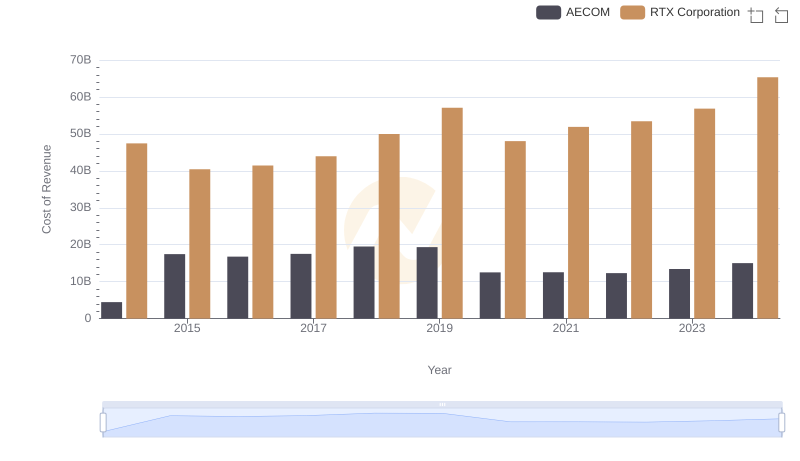
Cost Insights: Breaking Down RTX Corporation and AECOM's Expenses
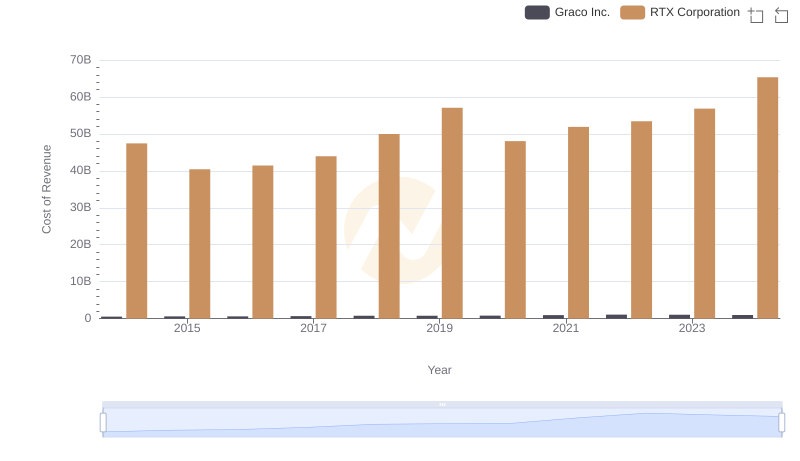
Cost of Revenue Trends: RTX Corporation vs Graco Inc.
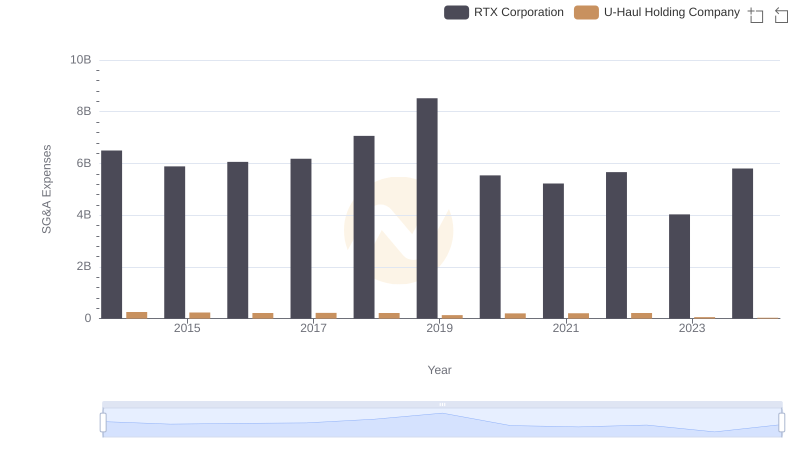
Comparing SG&A Expenses: RTX Corporation vs U-Haul Holding Company Trends and Insights

A Professional Review of EBITDA: RTX Corporation Compared to U-Haul Holding Company