| __timestamp | Fortinet, Inc. | Shopify Inc. |
|---|---|---|
| Wednesday, January 1, 2014 | 357151000 | 57495000 |
| Thursday, January 1, 2015 | 541885000 | 89105000 |
| Friday, January 1, 2016 | 707581000 | 172324000 |
| Sunday, January 1, 2017 | 788888000 | 293413000 |
| Monday, January 1, 2018 | 875300000 | 457513000 |
| Tuesday, January 1, 2019 | 1029000000 | 651775000 |
| Wednesday, January 1, 2020 | 1191400000 | 847391000 |
| Friday, January 1, 2021 | 1489200000 | 1276401000 |
| Saturday, January 1, 2022 | 1855100000 | 1938255000 |
| Sunday, January 1, 2023 | 2217300000 | 1711000000 |
| Monday, January 1, 2024 | 2282600000 | 1796000000 |
Igniting the spark of knowledge
In the ever-evolving landscape of technology, understanding the financial strategies of industry leaders is crucial. This analysis delves into the Selling, General, and Administrative (SG&A) expenses of Shopify Inc. and Fortinet, Inc. over the past decade.
From 2014 to 2023, both companies have shown remarkable growth in their SG&A expenses, reflecting their strategic investments in scaling operations and expanding market reach. Fortinet's expenses surged by over 520%, from $357 million in 2014 to $2.2 billion in 2023. Meanwhile, Shopify's expenses skyrocketed by an astonishing 2,870%, starting at a modest $57 million and peaking at $1.9 billion in 2022.
This trend underscores the aggressive expansion strategies of these tech giants. Fortinet's steady increase highlights its focus on consistent growth, while Shopify's rapid escalation points to its dynamic market penetration efforts. These insights offer a glimpse into the financial maneuvers that drive success in the competitive tech industry.
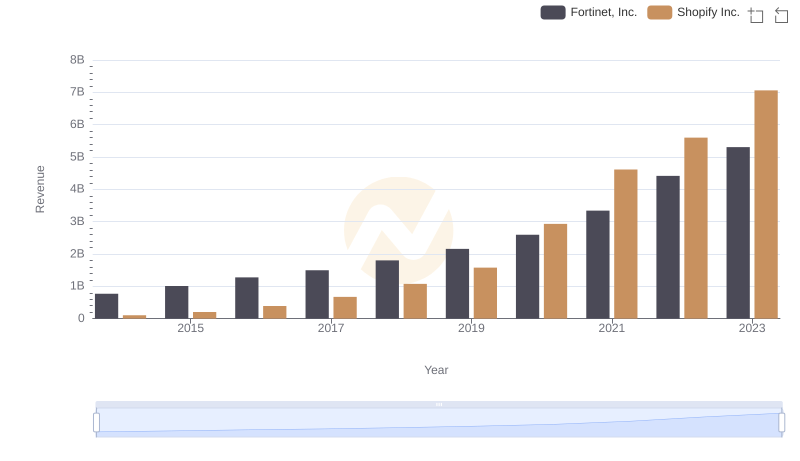
Revenue Showdown: Shopify Inc. vs Fortinet, Inc.
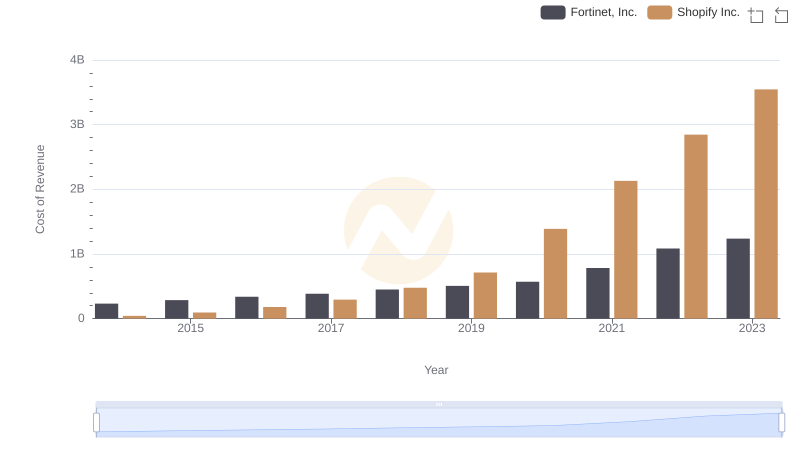
Comparing Cost of Revenue Efficiency: Shopify Inc. vs Fortinet, Inc.
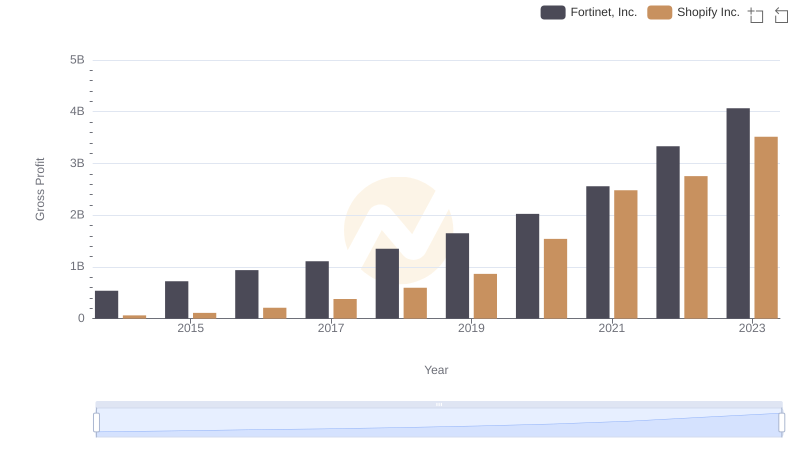
Who Generates Higher Gross Profit? Shopify Inc. or Fortinet, Inc.
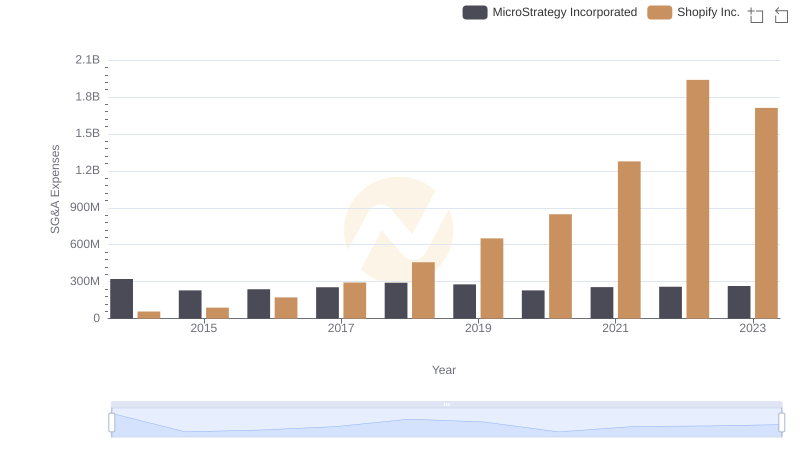
Cost Management Insights: SG&A Expenses for Shopify Inc. and MicroStrategy Incorporated
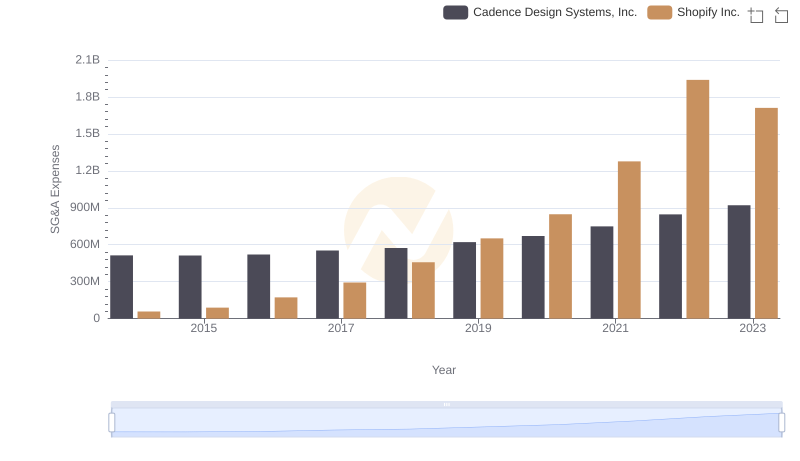
Operational Costs Compared: SG&A Analysis of Shopify Inc. and Cadence Design Systems, Inc.
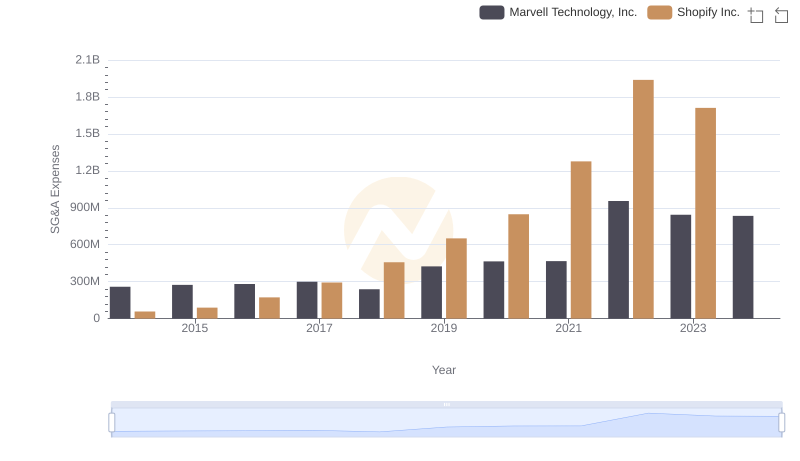
Breaking Down SG&A Expenses: Shopify Inc. vs Marvell Technology, Inc.
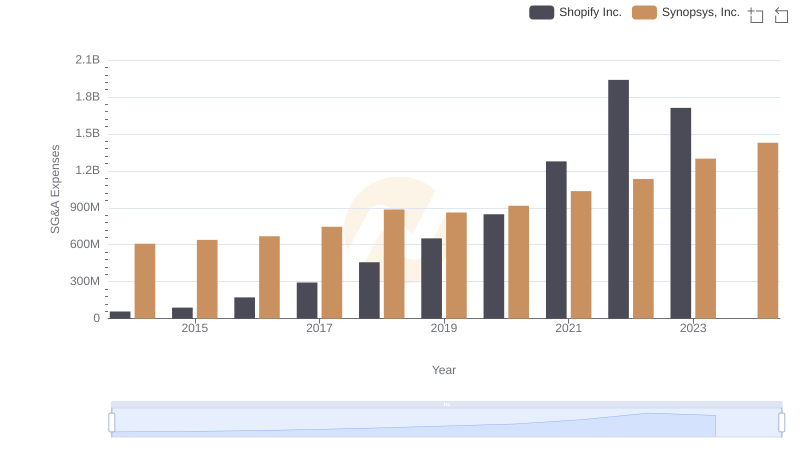
Breaking Down SG&A Expenses: Shopify Inc. vs Synopsys, Inc.
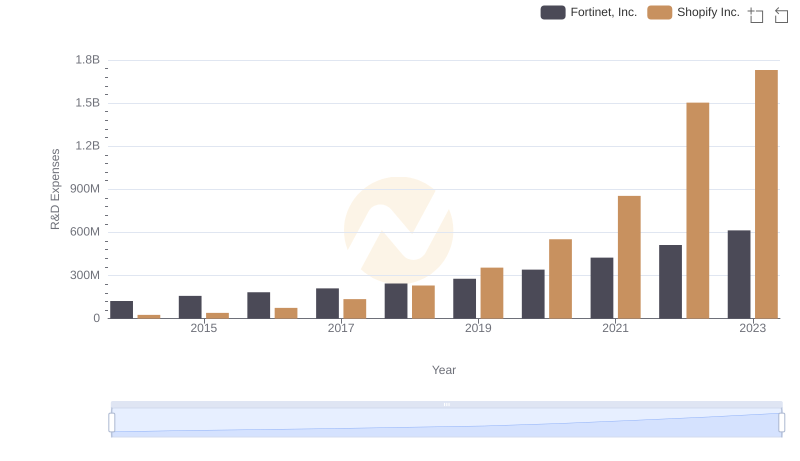
Analyzing R&D Budgets: Shopify Inc. vs Fortinet, Inc.
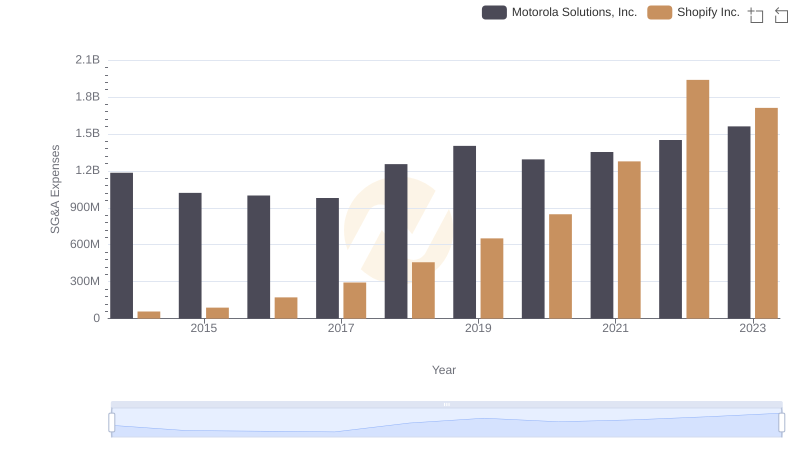
Cost Management Insights: SG&A Expenses for Shopify Inc. and Motorola Solutions, Inc.

Breaking Down SG&A Expenses: Shopify Inc. vs Workday, Inc.

Operational Costs Compared: SG&A Analysis of Shopify Inc. and Autodesk, Inc.
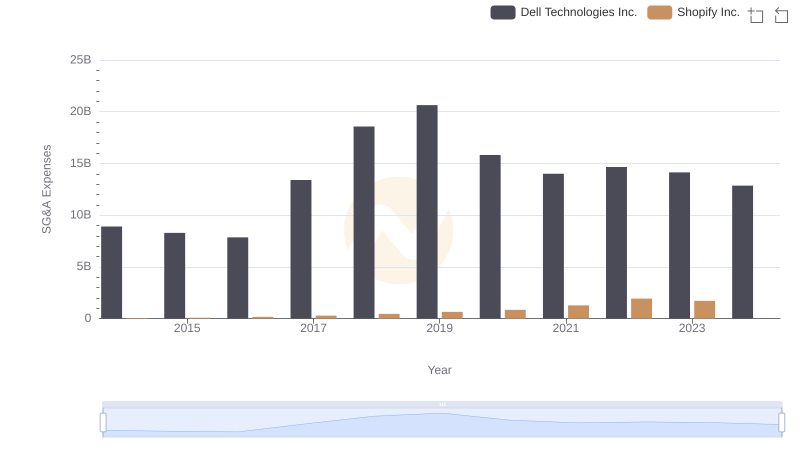
Comparing SG&A Expenses: Shopify Inc. vs Dell Technologies Inc. Trends and Insights