| __timestamp | SAP SE | Synopsys, Inc. |
|---|---|---|
| Wednesday, January 1, 2014 | 5195000000 | 608294000 |
| Thursday, January 1, 2015 | 6449000000 | 639504000 |
| Friday, January 1, 2016 | 7299000000 | 668330000 |
| Sunday, January 1, 2017 | 7999000000 | 746092000 |
| Monday, January 1, 2018 | 7879000000 | 885538000 |
| Tuesday, January 1, 2019 | 9318000000 | 862108000 |
| Wednesday, January 1, 2020 | 8461000000 | 916540000 |
| Friday, January 1, 2021 | 9936000000 | 1035479000 |
| Saturday, January 1, 2022 | 11015000000 | 1133617000 |
| Sunday, January 1, 2023 | 10192000000 | 1299327000 |
| Monday, January 1, 2024 | 10254000000 | 1427838000 |
Unveiling the hidden dimensions of data
In the ever-evolving tech industry, understanding financial trends is crucial. This analysis delves into the Selling, General, and Administrative (SG&A) expenses of two major players: SAP SE and Synopsys, Inc., from 2014 to 2023. Over this period, SAP SE's SG&A expenses have shown a steady increase, peaking in 2022 with a 112% rise from 2014. However, 2023 saw a slight dip, indicating potential cost optimization strategies.
Conversely, Synopsys, Inc. has demonstrated a consistent upward trajectory, with expenses growing by approximately 135% over the same period. Notably, 2024 data for SAP SE is missing, suggesting a need for further investigation. These insights highlight the contrasting financial strategies of these tech giants, offering a window into their operational priorities and market positioning.
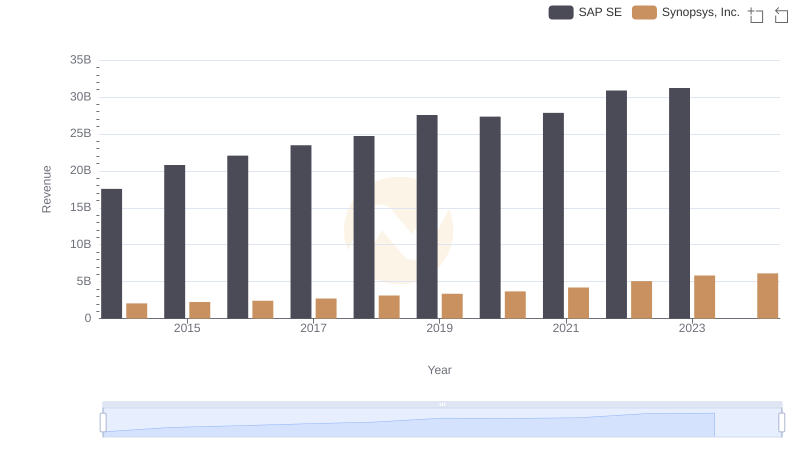
Revenue Showdown: SAP SE vs Synopsys, Inc.
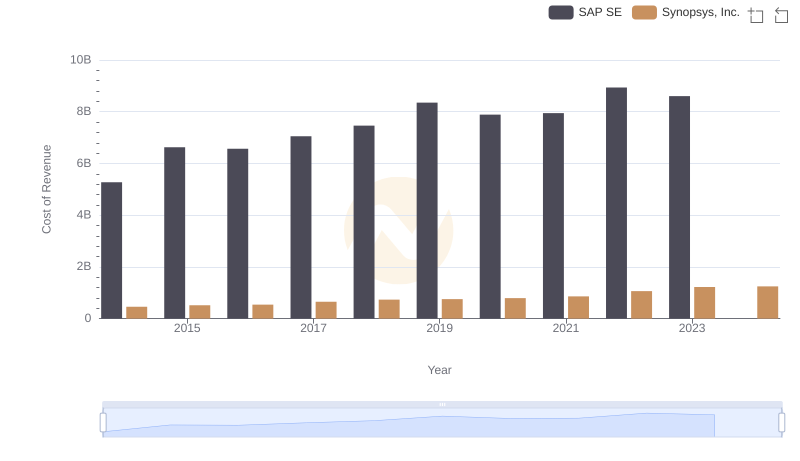
Cost Insights: Breaking Down SAP SE and Synopsys, Inc.'s Expenses
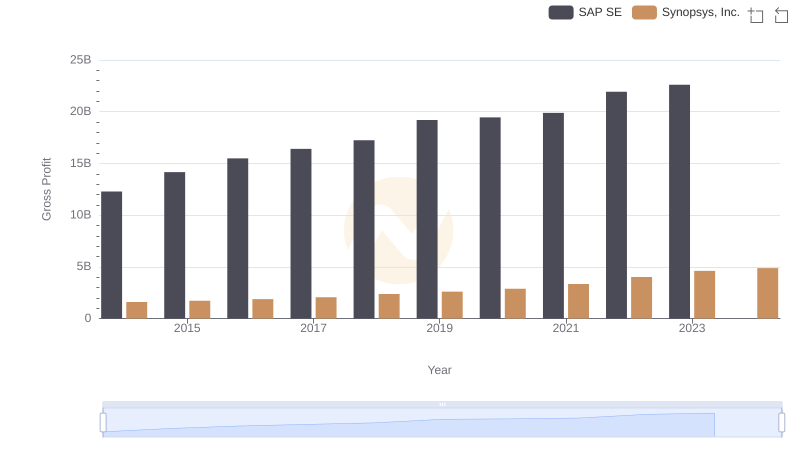
Gross Profit Analysis: Comparing SAP SE and Synopsys, Inc.
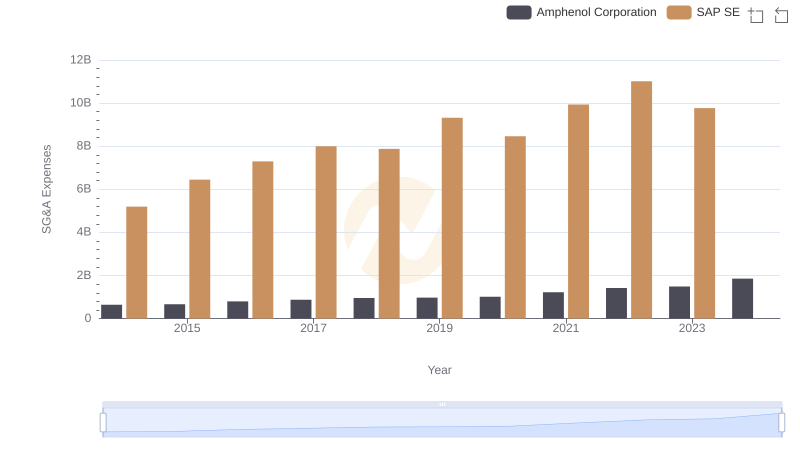
SAP SE vs Amphenol Corporation: SG&A Expense Trends
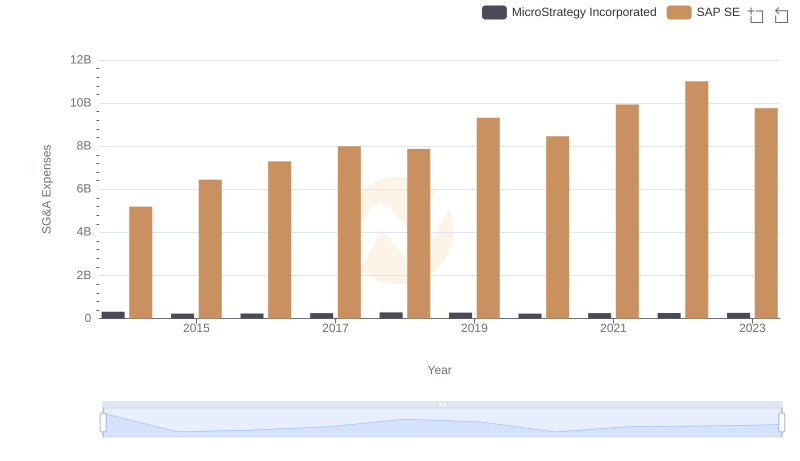
Cost Management Insights: SG&A Expenses for SAP SE and MicroStrategy Incorporated
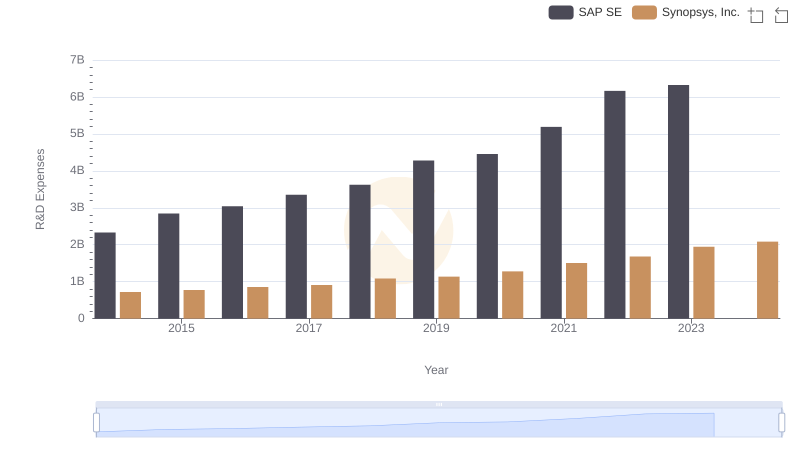
SAP SE or Synopsys, Inc.: Who Invests More in Innovation?
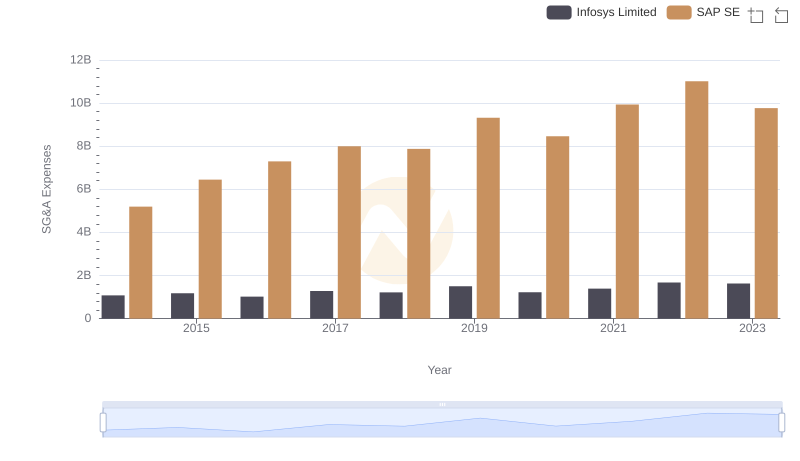
SAP SE or Infosys Limited: Who Manages SG&A Costs Better?
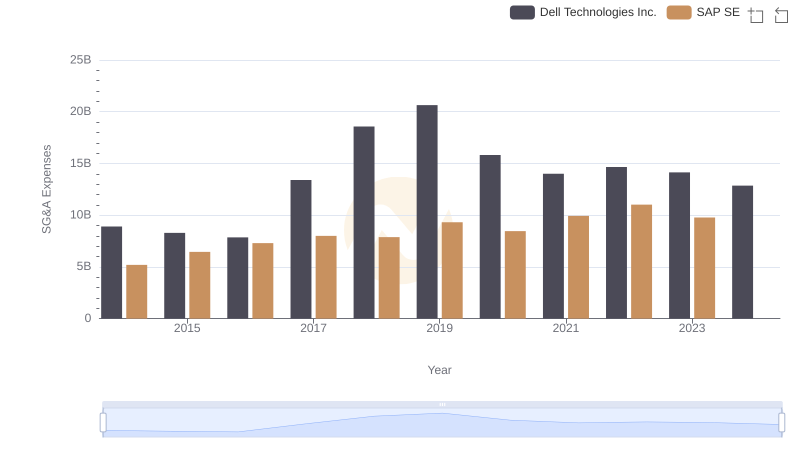
Who Optimizes SG&A Costs Better? SAP SE or Dell Technologies Inc.
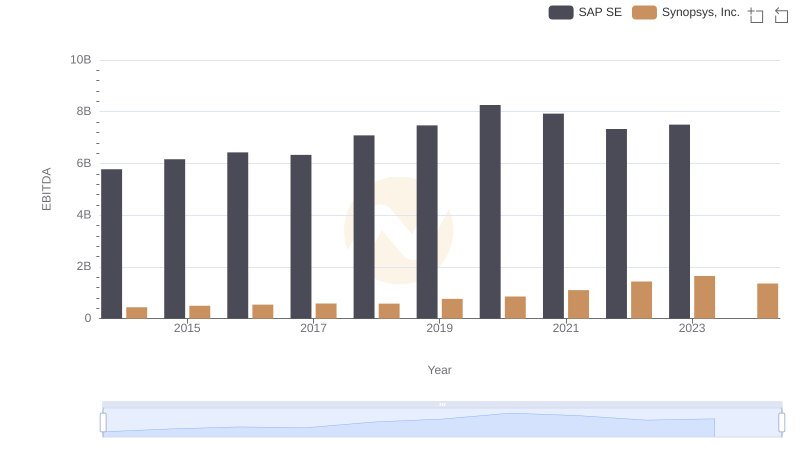
SAP SE vs Synopsys, Inc.: In-Depth EBITDA Performance Comparison
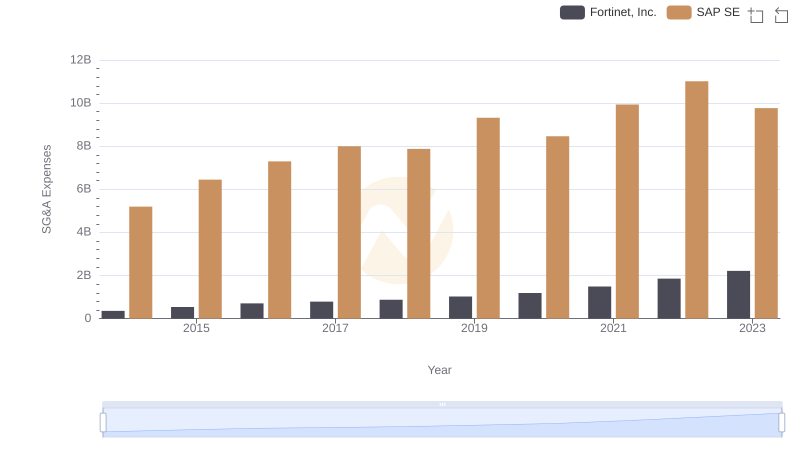
SG&A Efficiency Analysis: Comparing SAP SE and Fortinet, Inc.
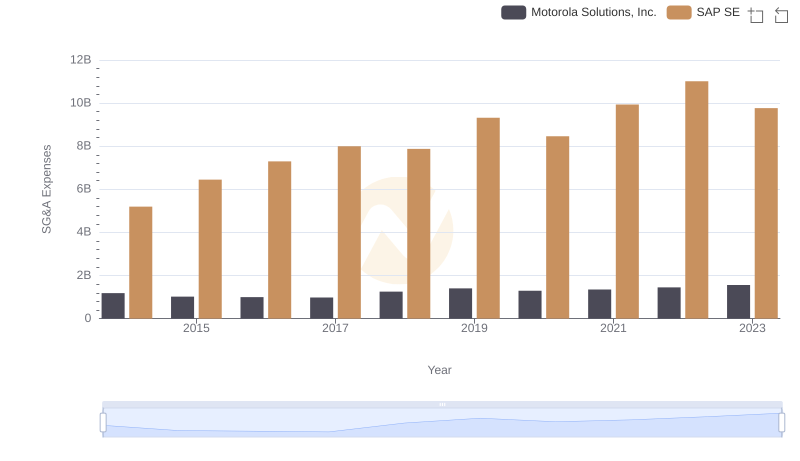
SAP SE and Motorola Solutions, Inc.: SG&A Spending Patterns Compared
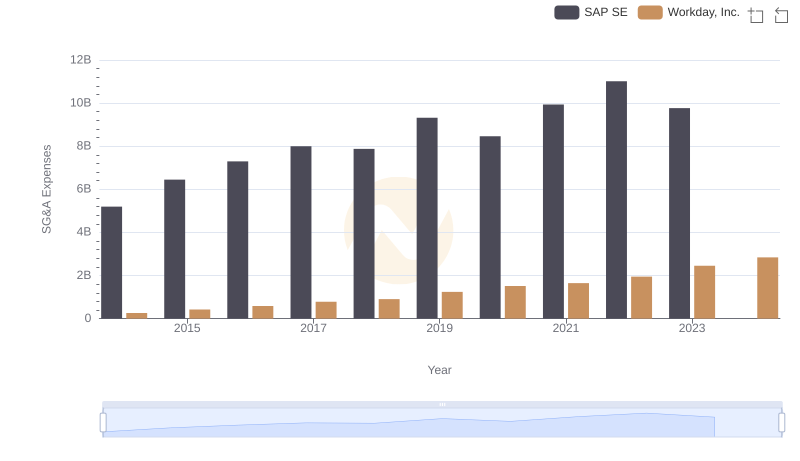
SAP SE vs Workday, Inc.: SG&A Expense Trends