| __timestamp | Takeda Pharmaceutical Company Limited | Taro Pharmaceutical Industries Ltd. |
|---|---|---|
| Wednesday, January 1, 2014 | 1777824000000 | 759285000 |
| Thursday, January 1, 2015 | 1807378000000 | 862944000 |
| Friday, January 1, 2016 | 1732051000000 | 950751000 |
| Sunday, January 1, 2017 | 1770531000000 | 879387000 |
| Monday, January 1, 2018 | 2097224000000 | 661913000 |
| Tuesday, January 1, 2019 | 3291188000000 | 669893000 |
| Wednesday, January 1, 2020 | 3197812000000 | 644769000 |
| Friday, January 1, 2021 | 3569006000000 | 548970000 |
| Saturday, January 1, 2022 | 4027478000000 | 561347000 |
| Sunday, January 1, 2023 | 4263762000000 | 572952000 |
| Monday, January 1, 2024 | 4263762000000 | 629182000 |
Infusing magic into the data realm
In the competitive world of pharmaceuticals, revenue growth is a key indicator of success. Over the past decade, Takeda Pharmaceutical Company Limited has demonstrated a robust upward trajectory in revenue, growing by approximately 140% from 2014 to 2024. This Japanese giant's revenue peaked at an impressive 4.26 trillion in 2023 and 2024, showcasing its dominance in the industry.
In contrast, Taro Pharmaceutical Industries Ltd., while maintaining steady growth, has seen its revenue hover around the 600 million mark in recent years. Despite a slight dip in 2021, Taro's revenue has shown resilience, with a modest increase of about 15% from 2014 to 2024.
This comparison highlights the stark differences in scale and growth between these two companies, offering insights into their strategic positioning and market influence.
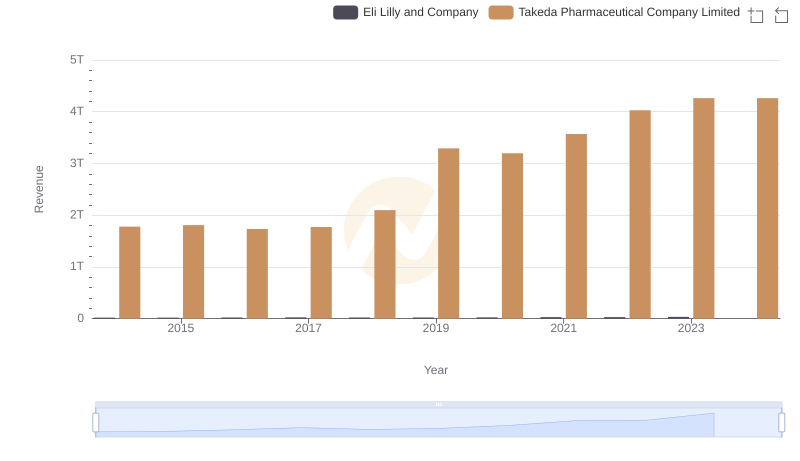
Eli Lilly and Company and Takeda Pharmaceutical Company Limited: A Comprehensive Revenue Analysis
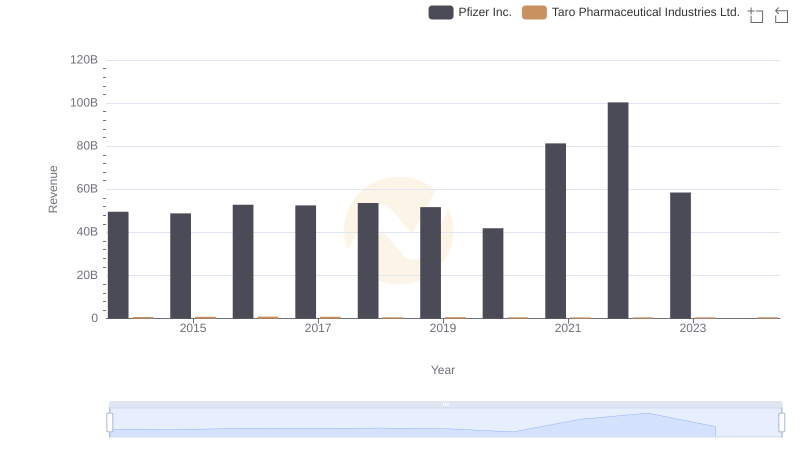
Revenue Insights: Pfizer Inc. and Taro Pharmaceutical Industries Ltd. Performance Compared
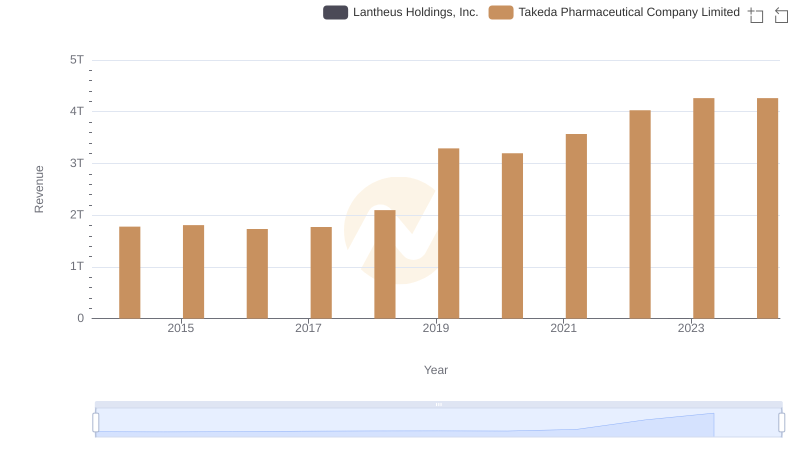
Takeda Pharmaceutical Company Limited vs Lantheus Holdings, Inc.: Examining Key Revenue Metrics
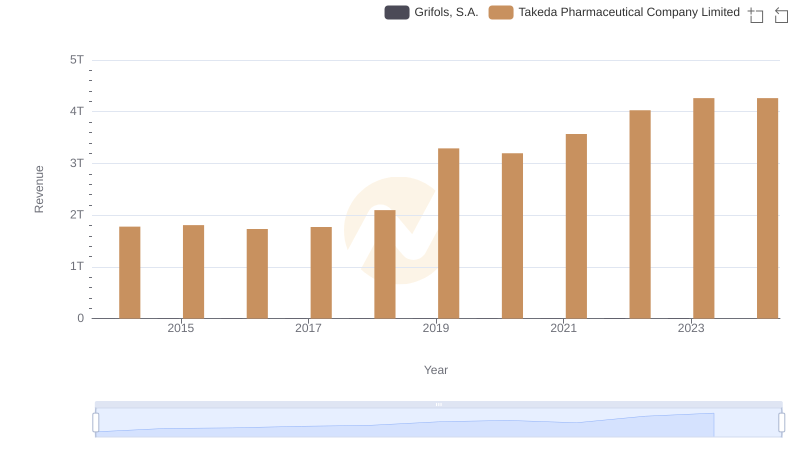
Takeda Pharmaceutical Company Limited vs Grifols, S.A.: Examining Key Revenue Metrics
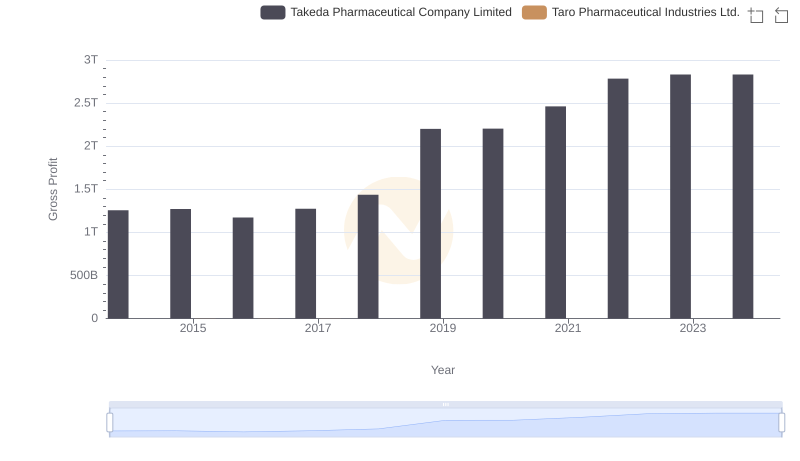
Gross Profit Trends Compared: Takeda Pharmaceutical Company Limited vs Taro Pharmaceutical Industries Ltd.
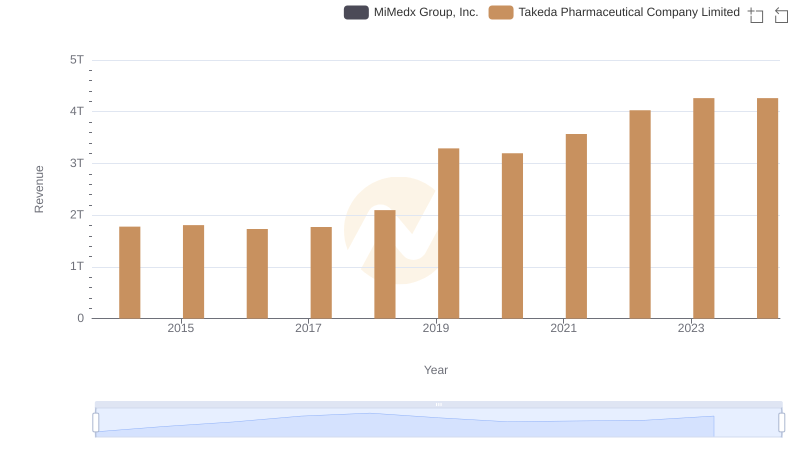
Revenue Insights: Takeda Pharmaceutical Company Limited and MiMedx Group, Inc. Performance Compared
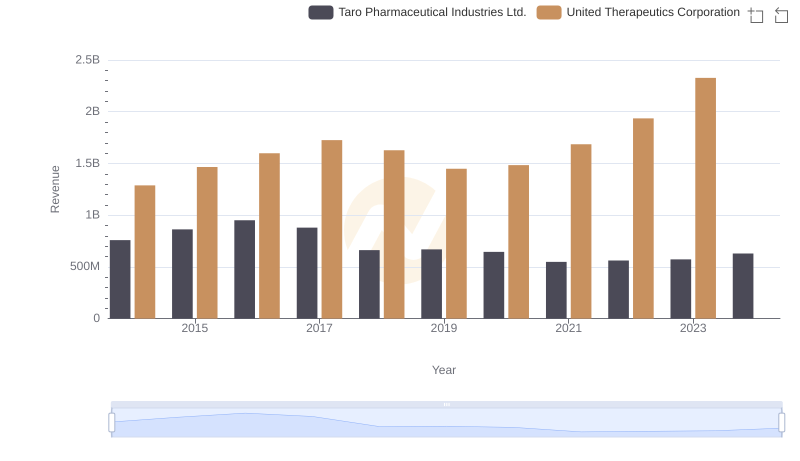
Revenue Showdown: United Therapeutics Corporation vs Taro Pharmaceutical Industries Ltd.
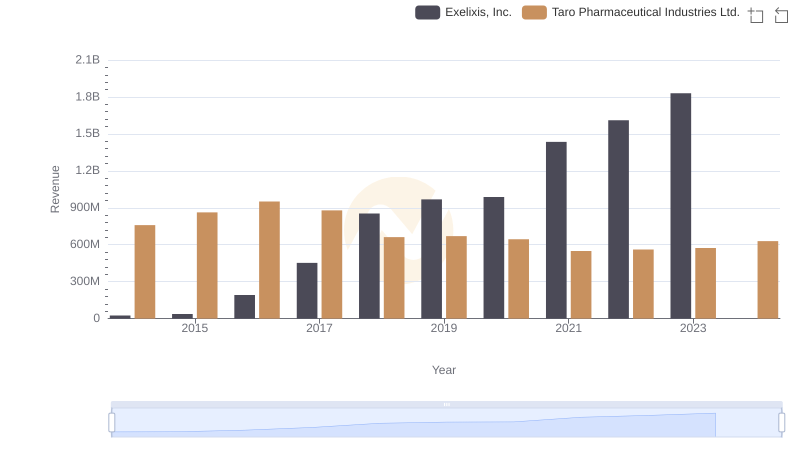
Breaking Down Revenue Trends: Exelixis, Inc. vs Taro Pharmaceutical Industries Ltd.
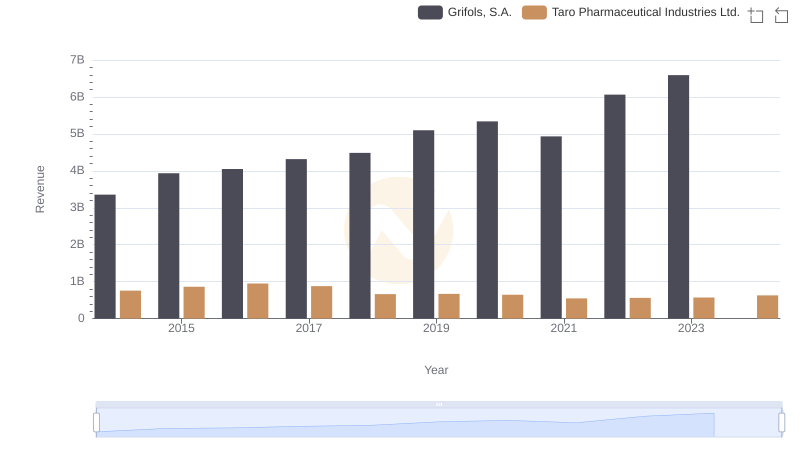
Annual Revenue Comparison: Grifols, S.A. vs Taro Pharmaceutical Industries Ltd.
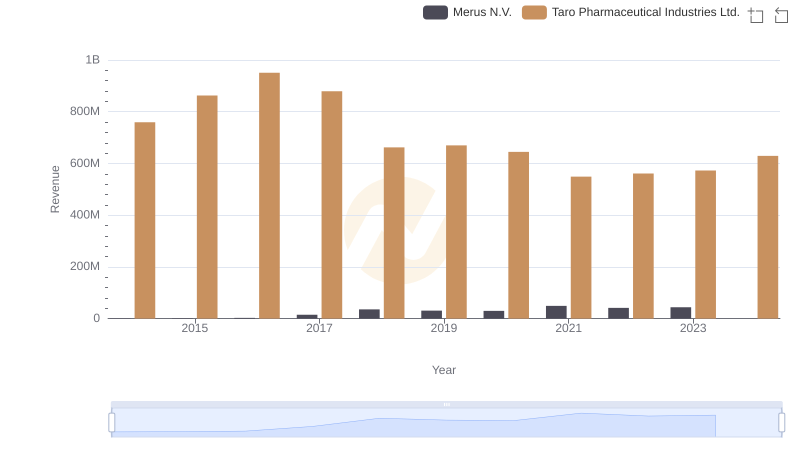
Merus N.V. or Taro Pharmaceutical Industries Ltd.: Who Leads in Yearly Revenue?
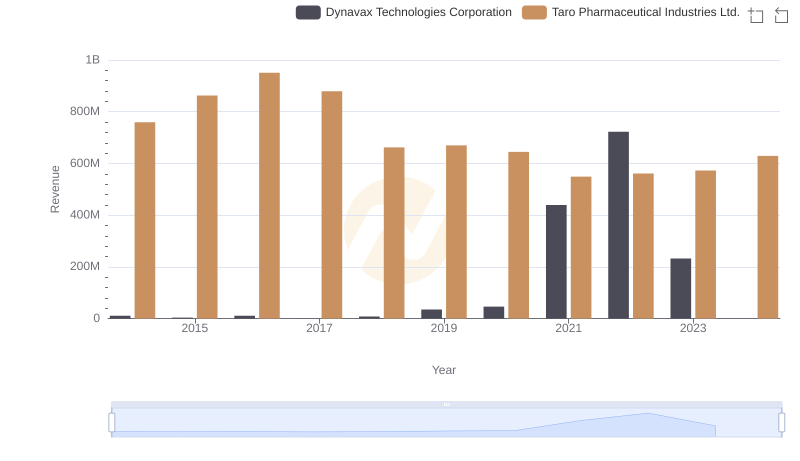
Dynavax Technologies Corporation vs Taro Pharmaceutical Industries Ltd.: Examining Key Revenue Metrics
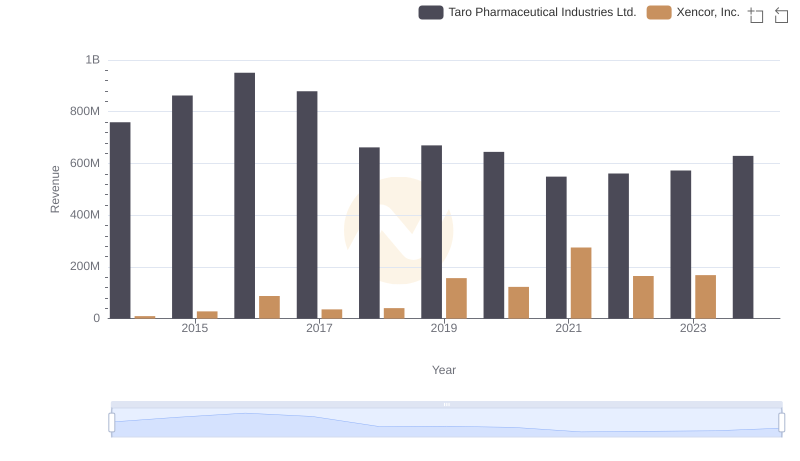
Breaking Down Revenue Trends: Taro Pharmaceutical Industries Ltd. vs Xencor, Inc.