| __timestamp | Curtiss-Wright Corporation | ITT Inc. |
|---|---|---|
| Wednesday, January 1, 2014 | 2243126000 | 2654600000 |
| Thursday, January 1, 2015 | 2205683000 | 2485600000 |
| Friday, January 1, 2016 | 2108931000 | 2405400000 |
| Sunday, January 1, 2017 | 2271026000 | 2585300000 |
| Monday, January 1, 2018 | 2411835000 | 2745100000 |
| Tuesday, January 1, 2019 | 2487961000 | 2846400000 |
| Wednesday, January 1, 2020 | 2391336000 | 2477800000 |
| Friday, January 1, 2021 | 2505931000 | 2765000000 |
| Saturday, January 1, 2022 | 2557025000 | 2987700000 |
| Sunday, January 1, 2023 | 2845373000 | 3283000000 |
| Monday, January 1, 2024 | 3121189000 | 3630700000 |
In pursuit of knowledge
In the competitive landscape of industrial manufacturing, Curtiss-Wright Corporation and ITT Inc. have been pivotal players. Over the past decade, from 2014 to 2023, these companies have demonstrated significant revenue growth, reflecting their strategic prowess and market adaptability.
Curtiss-Wright Corporation, known for its engineering solutions, saw its revenue grow by approximately 28% over this period. Starting at a revenue base of around $2.24 billion in 2014, it reached nearly $2.85 billion by 2023. Meanwhile, ITT Inc., a leader in fluid technology and motion control, outpaced Curtiss-Wright with a 24% increase, climbing from $2.65 billion to $3.28 billion.
This comparison highlights ITT Inc.'s consistent edge in revenue performance, maintaining a lead of about 15% over Curtiss-Wright. As both companies continue to innovate, their financial trajectories will be crucial for investors and industry analysts alike.

Annual Revenue Comparison: Curtiss-Wright Corporation vs C.H. Robinson Worldwide, Inc.
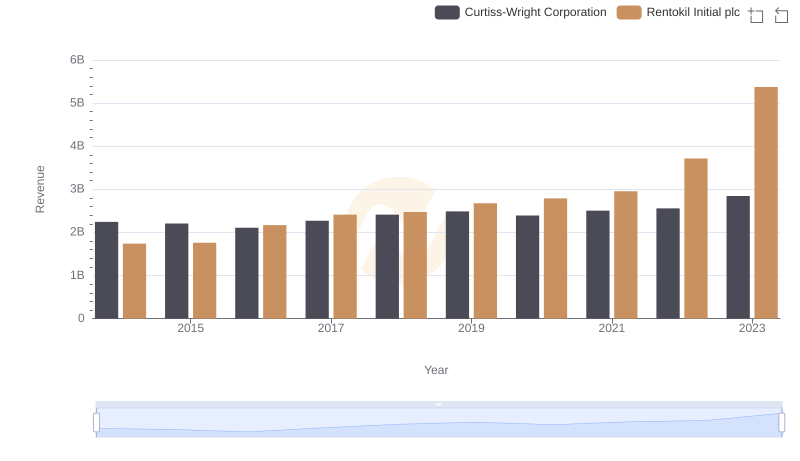
Curtiss-Wright Corporation vs Rentokil Initial plc: Examining Key Revenue Metrics
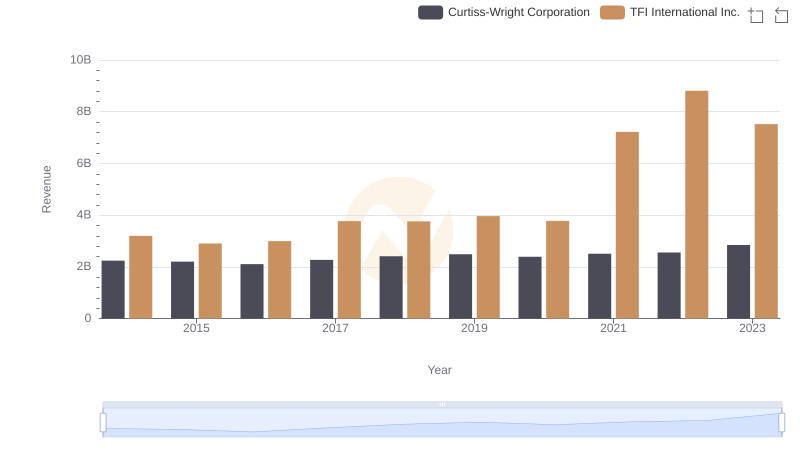
Revenue Showdown: Curtiss-Wright Corporation vs TFI International Inc.
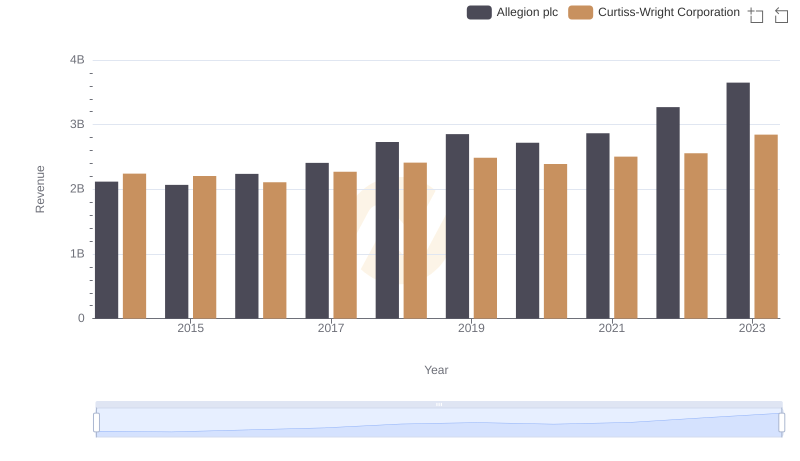
Curtiss-Wright Corporation and Allegion plc: A Comprehensive Revenue Analysis
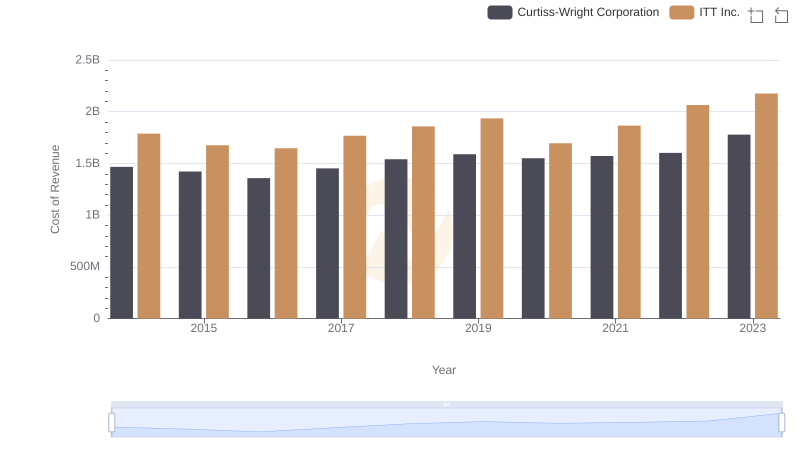
Curtiss-Wright Corporation vs ITT Inc.: Efficiency in Cost of Revenue Explored
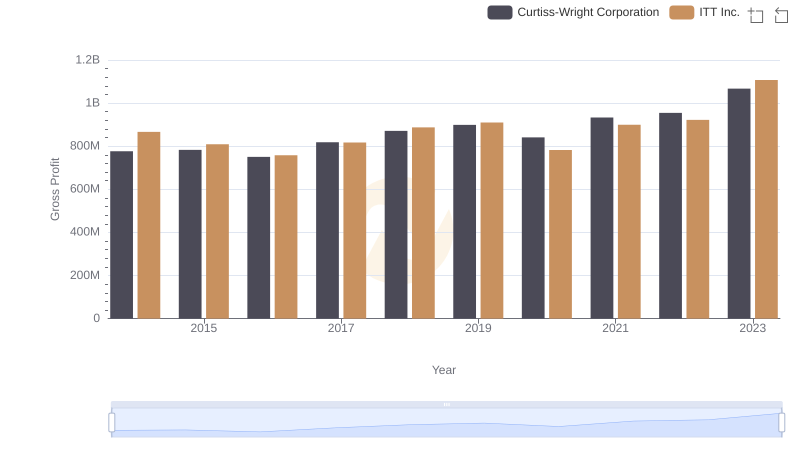
Who Generates Higher Gross Profit? Curtiss-Wright Corporation or ITT Inc.
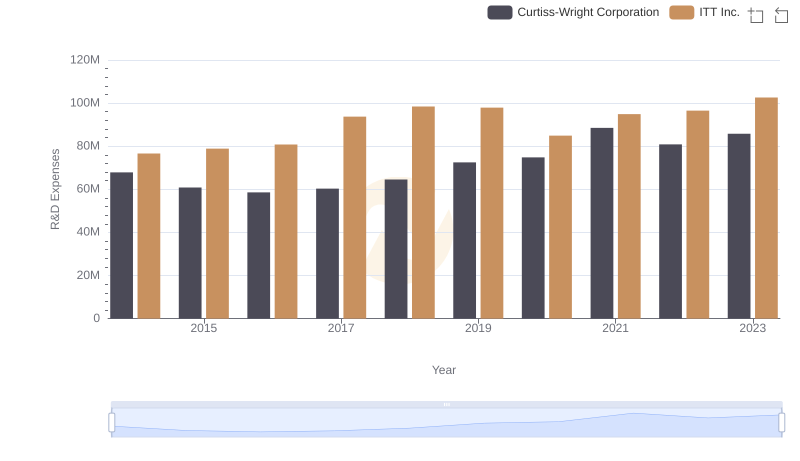
R&D Insights: How Curtiss-Wright Corporation and ITT Inc. Allocate Funds
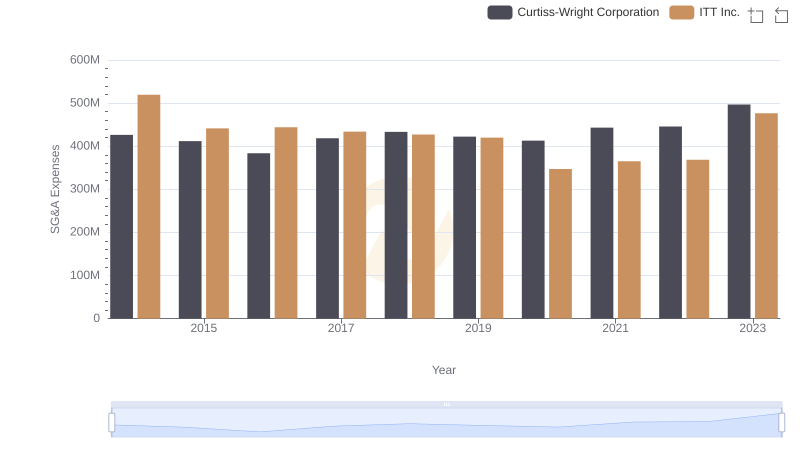
Selling, General, and Administrative Costs: Curtiss-Wright Corporation vs ITT Inc.
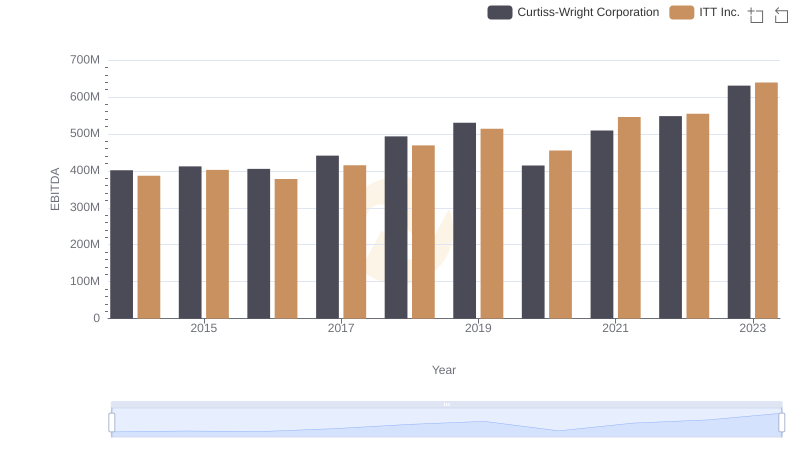
A Professional Review of EBITDA: Curtiss-Wright Corporation Compared to ITT Inc.