| __timestamp | Corpay, Inc. | Micron Technology, Inc. |
|---|---|---|
| Wednesday, January 1, 2014 | 269591000 | 10921000000 |
| Thursday, January 1, 2015 | 439330000 | 10977000000 |
| Friday, January 1, 2016 | 621965000 | 9894000000 |
| Sunday, January 1, 2017 | 756337000 | 11886000000 |
| Monday, January 1, 2018 | 692584000 | 12500000000 |
| Tuesday, January 1, 2019 | 726044000 | 12704000000 |
| Wednesday, January 1, 2020 | 596363000 | 14883000000 |
| Friday, January 1, 2021 | 559819000 | 17282000000 |
| Saturday, January 1, 2022 | 764707000 | 16860000000 |
| Sunday, January 1, 2023 | 819908000 | 16956000000 |
| Monday, January 1, 2024 | 0 | 19498000000 |
Cracking the code
In the ever-evolving landscape of technology and finance, understanding cost efficiency is crucial. Over the past decade, Micron Technology, Inc. and Corpay, Inc. have showcased contrasting trajectories in their cost of revenue. From 2014 to 2023, Micron Technology's cost of revenue has consistently dwarfed that of Corpay, averaging around 14 times higher. This reflects Micron's expansive operations in the semiconductor industry, where high production costs are the norm. Meanwhile, Corpay, a player in the financial services sector, has maintained a more modest cost structure, with a notable 204% increase from 2014 to 2023. Interestingly, 2024 data for Corpay is missing, leaving room for speculation on its future efficiency. As these companies navigate their respective industries, their cost management strategies will be pivotal in determining their competitive edge.
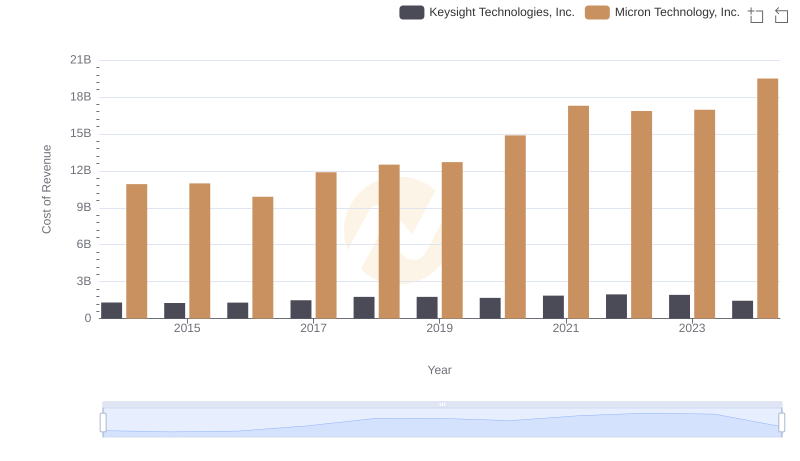
Cost of Revenue Comparison: Micron Technology, Inc. vs Keysight Technologies, Inc.
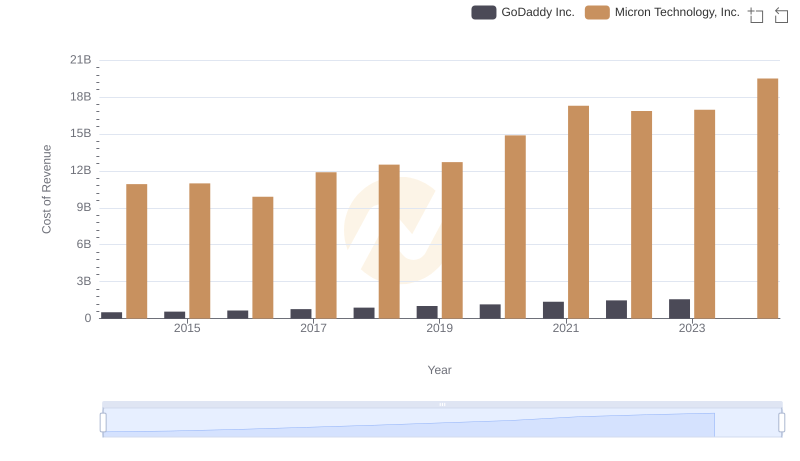
Cost of Revenue: Key Insights for Micron Technology, Inc. and GoDaddy Inc.
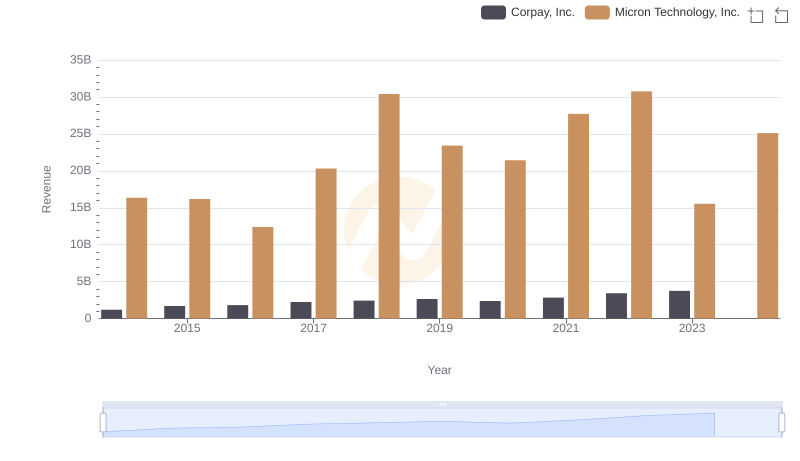
Micron Technology, Inc. vs Corpay, Inc.: Annual Revenue Growth Compared
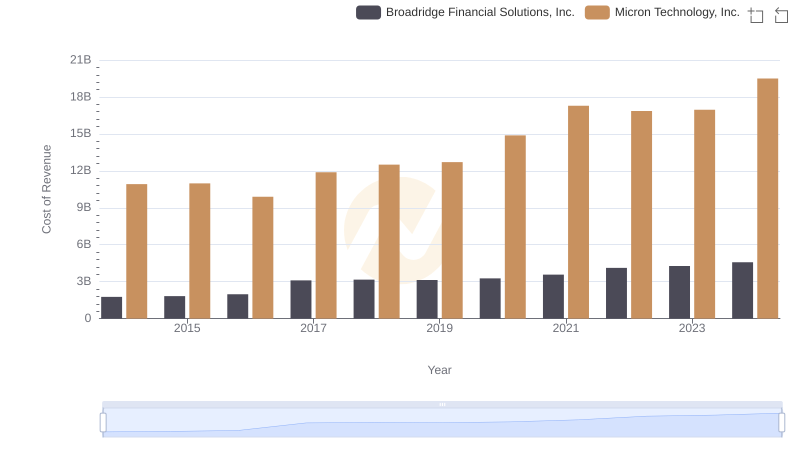
Cost of Revenue Comparison: Micron Technology, Inc. vs Broadridge Financial Solutions, Inc.
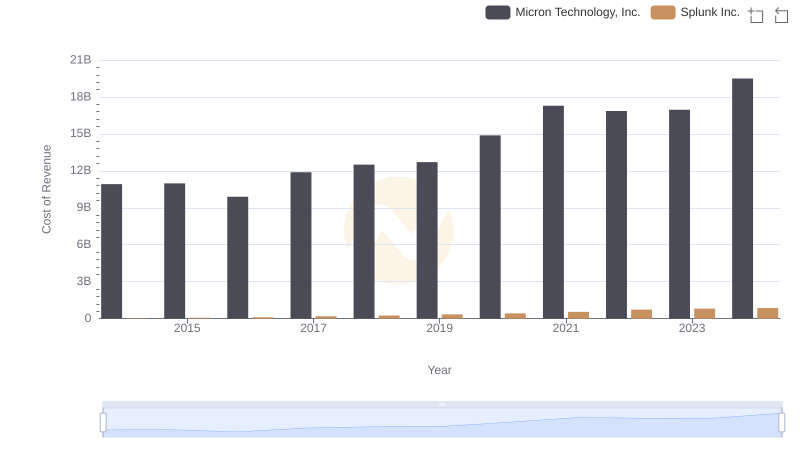
Cost of Revenue Trends: Micron Technology, Inc. vs Splunk Inc.
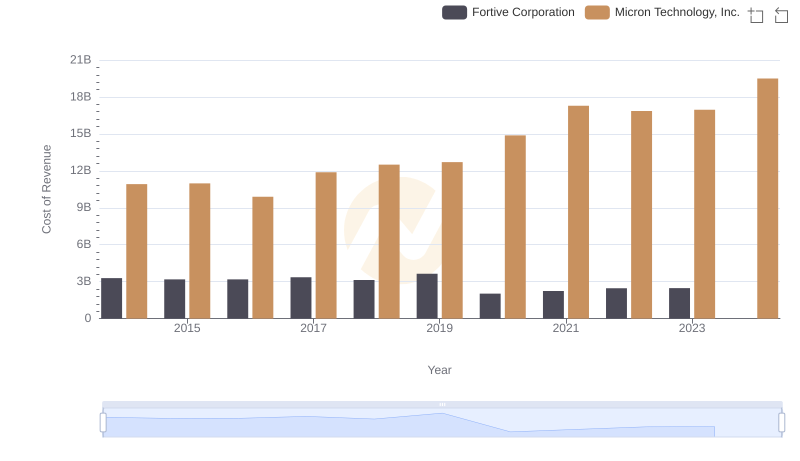
Cost of Revenue: Key Insights for Micron Technology, Inc. and Fortive Corporation
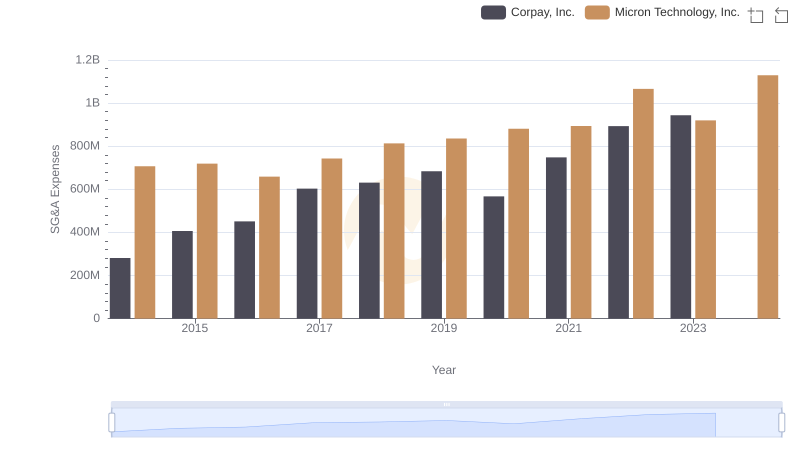
Selling, General, and Administrative Costs: Micron Technology, Inc. vs Corpay, Inc.
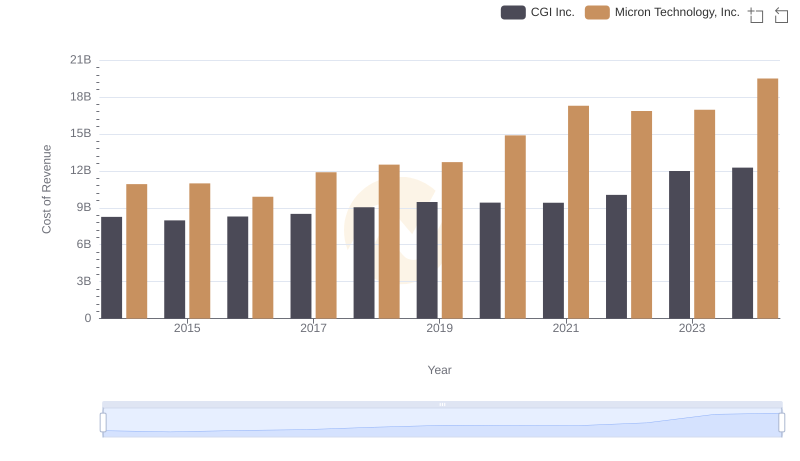
Cost of Revenue Trends: Micron Technology, Inc. vs CGI Inc.
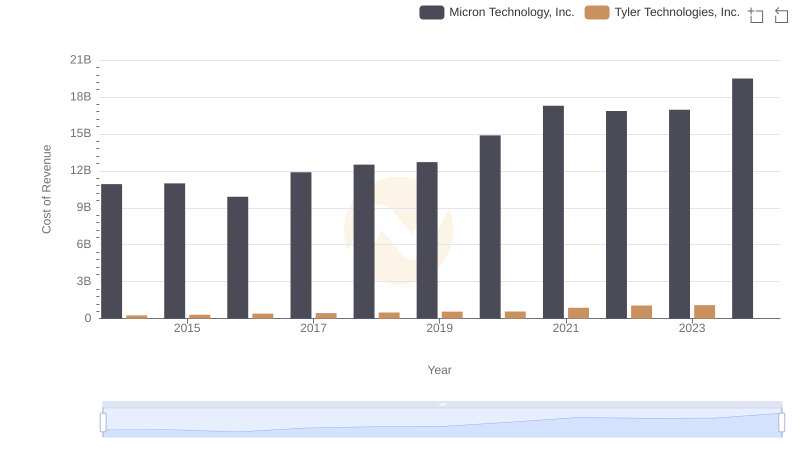
Analyzing Cost of Revenue: Micron Technology, Inc. and Tyler Technologies, Inc.
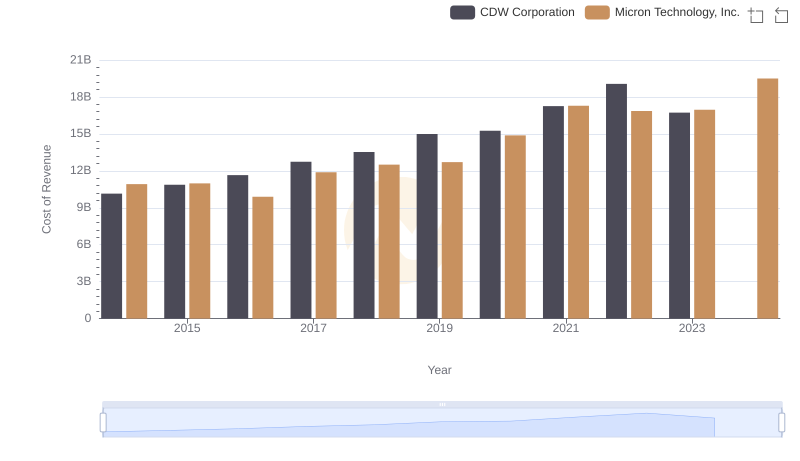
Cost of Revenue: Key Insights for Micron Technology, Inc. and CDW Corporation
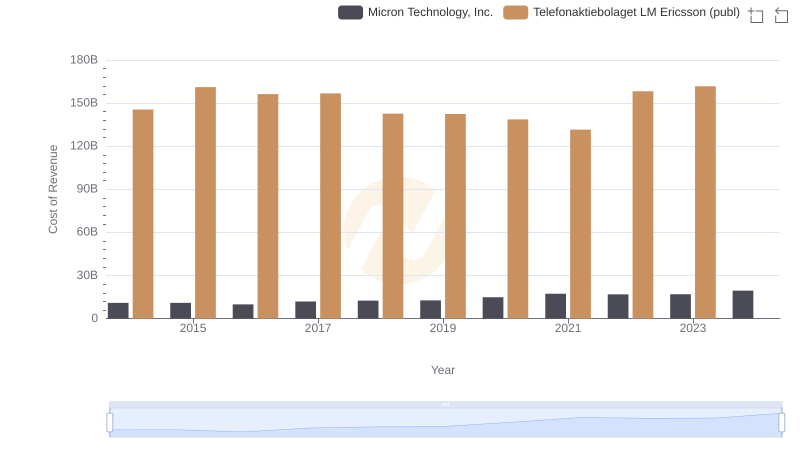
Micron Technology, Inc. vs Telefonaktiebolaget LM Ericsson (publ): Efficiency in Cost of Revenue Explored
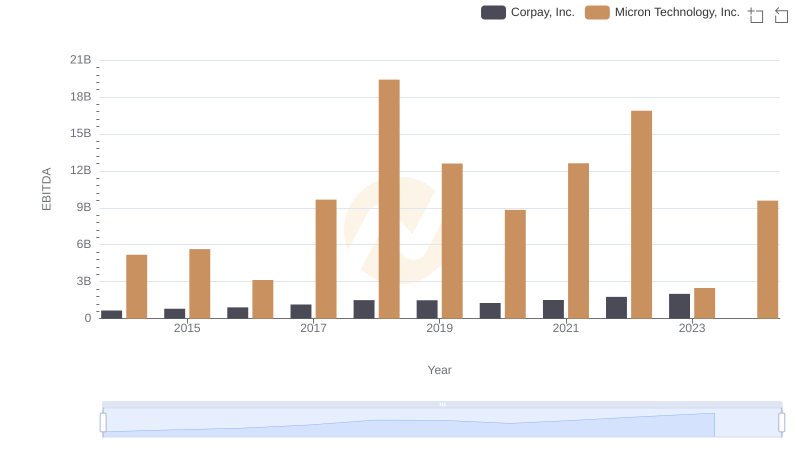
Comprehensive EBITDA Comparison: Micron Technology, Inc. vs Corpay, Inc.