| __timestamp | Deere & Company | Verisk Analytics, Inc. |
|---|---|---|
| Wednesday, January 1, 2014 | 24775800000 | 716598000 |
| Thursday, January 1, 2015 | 20143200000 | 803274000 |
| Friday, January 1, 2016 | 18248900000 | 714400000 |
| Sunday, January 1, 2017 | 19933500000 | 783800000 |
| Monday, January 1, 2018 | 25571200000 | 886200000 |
| Tuesday, January 1, 2019 | 26792000000 | 976800000 |
| Wednesday, January 1, 2020 | 23677000000 | 993900000 |
| Friday, January 1, 2021 | 29116000000 | 1057800000 |
| Saturday, January 1, 2022 | 35338000000 | 824600000 |
| Sunday, January 1, 2023 | 40105000000 | 876500000 |
| Monday, January 1, 2024 | 30775000000 |
Unleashing the power of data
In the world of industrial and analytics giants, Deere & Company and Verisk Analytics, Inc. stand as titans in their respective fields. Over the past decade, from 2014 to 2023, these companies have showcased contrasting approaches to managing their cost of revenue. Deere & Company, a leader in agricultural machinery, has seen its cost of revenue grow by approximately 62%, peaking in 2023. This reflects its expansive operations and the increasing demand for its products. In contrast, Verisk Analytics, a data analytics powerhouse, has maintained a relatively stable cost of revenue, with a modest increase of around 22% over the same period. This stability highlights Verisk's efficiency in managing operational costs despite the growing complexity of data analytics. Notably, data for 2024 is incomplete, leaving room for speculation on future trends. This comparison underscores the diverse strategies employed by industry leaders in optimizing their financial performance.

Annual Revenue Comparison: Deere & Company vs Verisk Analytics, Inc.
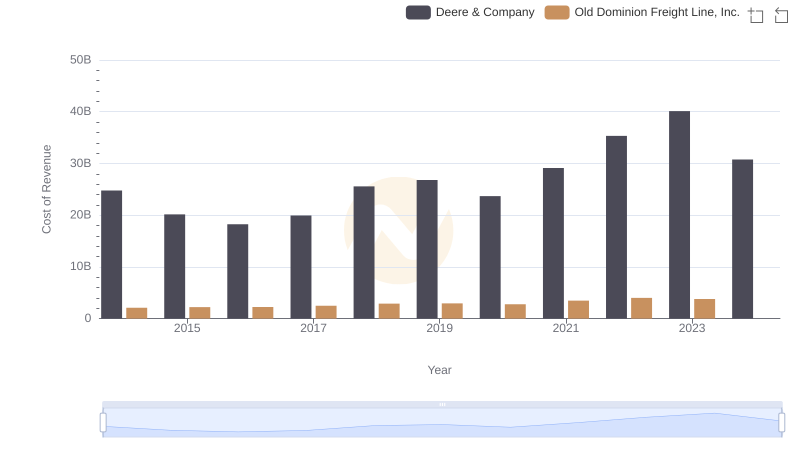
Comparing Cost of Revenue Efficiency: Deere & Company vs Old Dominion Freight Line, Inc.
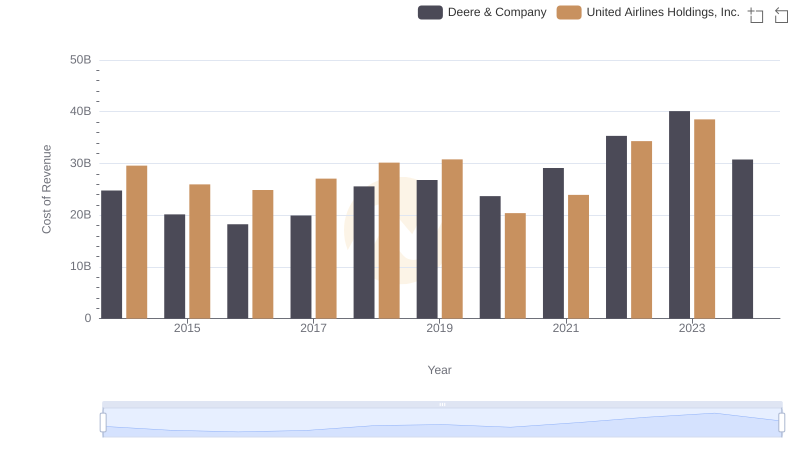
Analyzing Cost of Revenue: Deere & Company and United Airlines Holdings, Inc.
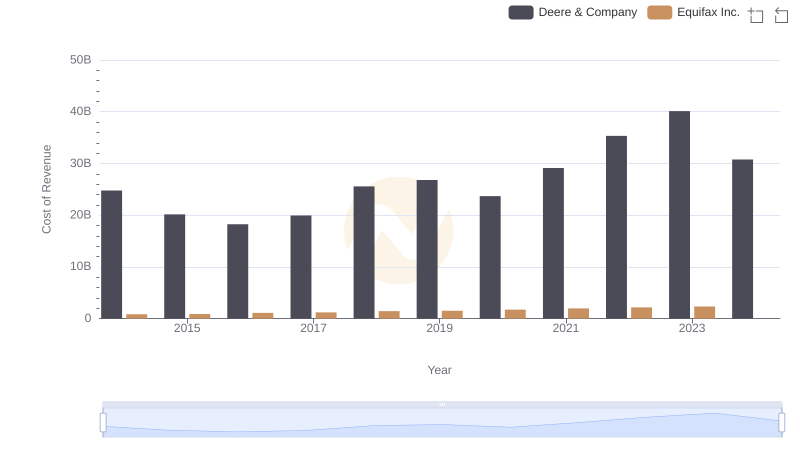
Cost of Revenue: Key Insights for Deere & Company and Equifax Inc.
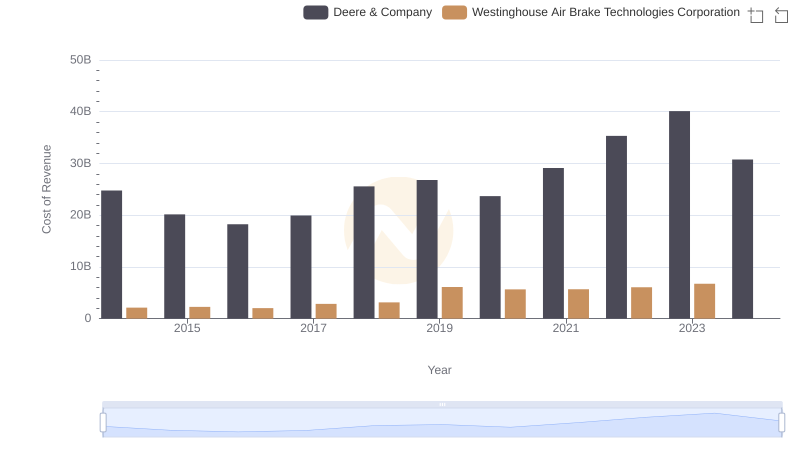
Cost of Revenue: Key Insights for Deere & Company and Westinghouse Air Brake Technologies Corporation
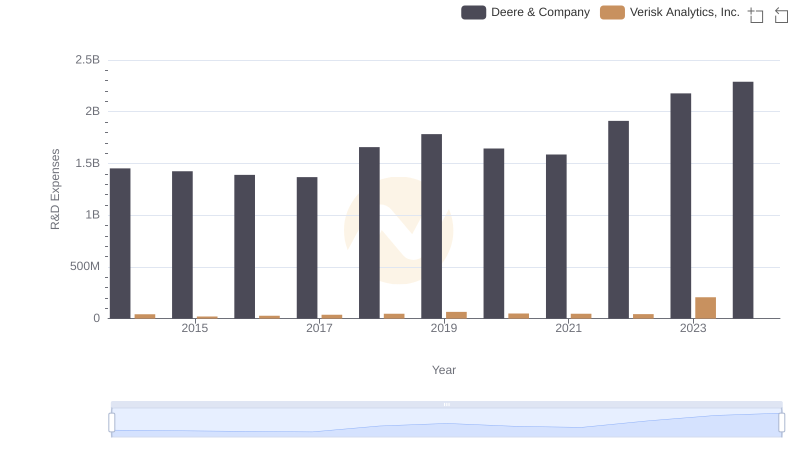
R&D Spending Showdown: Deere & Company vs Verisk Analytics, Inc.
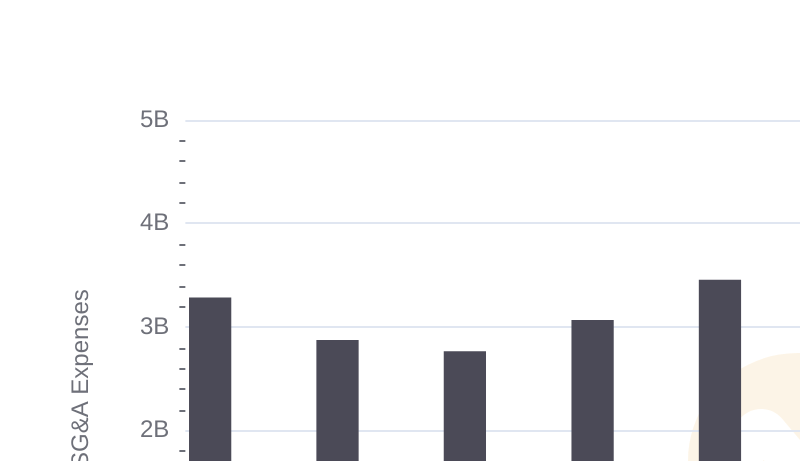
Deere & Company or Verisk Analytics, Inc.: Who Manages SG&A Costs Better?