| __timestamp | Carlisle Companies Incorporated | Masco Corporation |
|---|---|---|
| Wednesday, January 1, 2014 | 2384500000 | 6134000000 |
| Thursday, January 1, 2015 | 2536500000 | 4889000000 |
| Friday, January 1, 2016 | 2518100000 | 4901000000 |
| Sunday, January 1, 2017 | 2941900000 | 5033000000 |
| Monday, January 1, 2018 | 3304800000 | 5670000000 |
| Tuesday, January 1, 2019 | 3439900000 | 4336000000 |
| Wednesday, January 1, 2020 | 2832500000 | 4601000000 |
| Friday, January 1, 2021 | 3495600000 | 5512000000 |
| Saturday, January 1, 2022 | 4434500000 | 5967000000 |
| Sunday, January 1, 2023 | 3042900000 | 5131000000 |
| Monday, January 1, 2024 | 3115900000 | 4997000000 |
Igniting the spark of knowledge
In the competitive landscape of industrial manufacturing, understanding cost efficiency is crucial. Carlisle Companies Incorporated and Masco Corporation, two giants in the industry, have shown distinct trends in their cost of revenue from 2014 to 2023. Carlisle's cost of revenue has seen a notable increase of approximately 28% over this period, peaking in 2022. Meanwhile, Masco's cost of revenue has fluctuated, with a significant dip in 2019, but overall, it has remained relatively stable, with a slight increase of about 5% over the years.
These insights provide a window into the operational strategies of these companies, offering valuable lessons in cost management and efficiency.
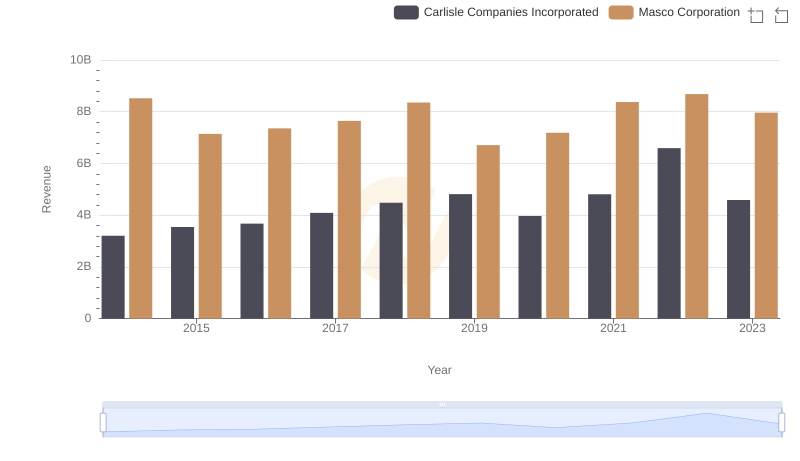
Revenue Insights: Carlisle Companies Incorporated and Masco Corporation Performance Compared
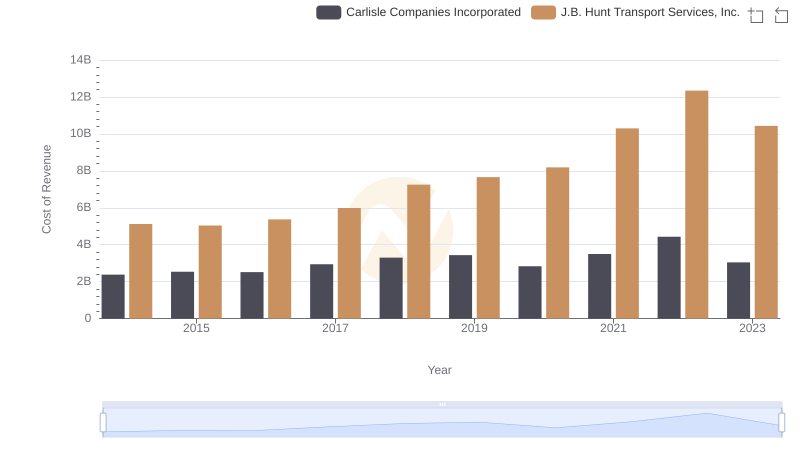
Cost Insights: Breaking Down Carlisle Companies Incorporated and J.B. Hunt Transport Services, Inc.'s Expenses
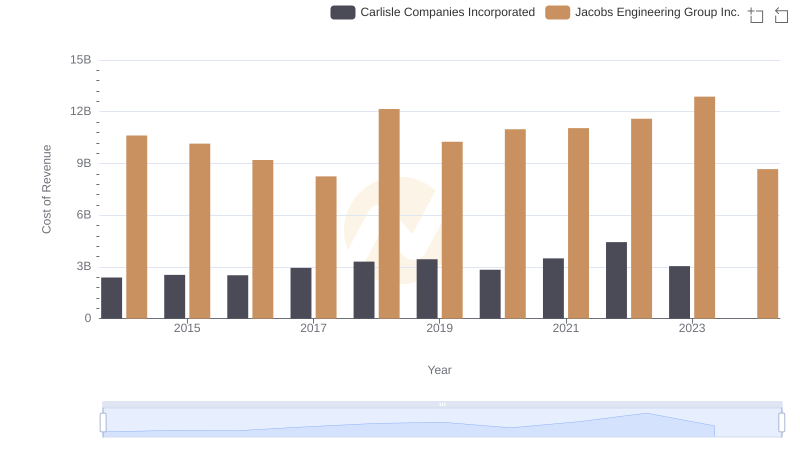
Cost of Revenue Comparison: Carlisle Companies Incorporated vs Jacobs Engineering Group Inc.
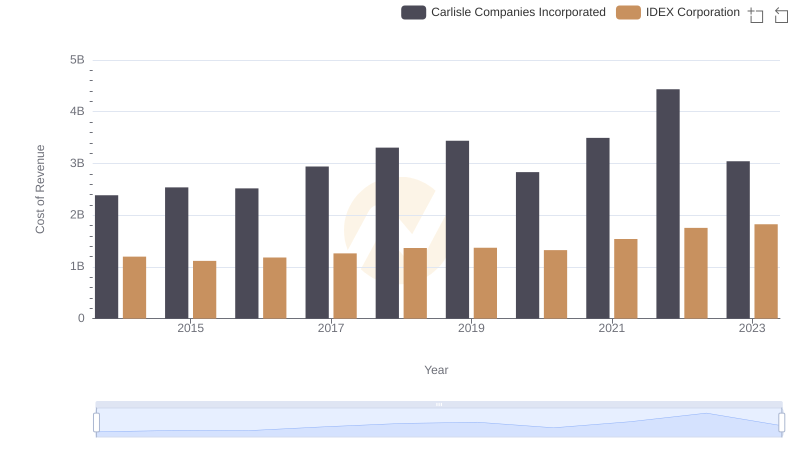
Comparing Cost of Revenue Efficiency: Carlisle Companies Incorporated vs IDEX Corporation
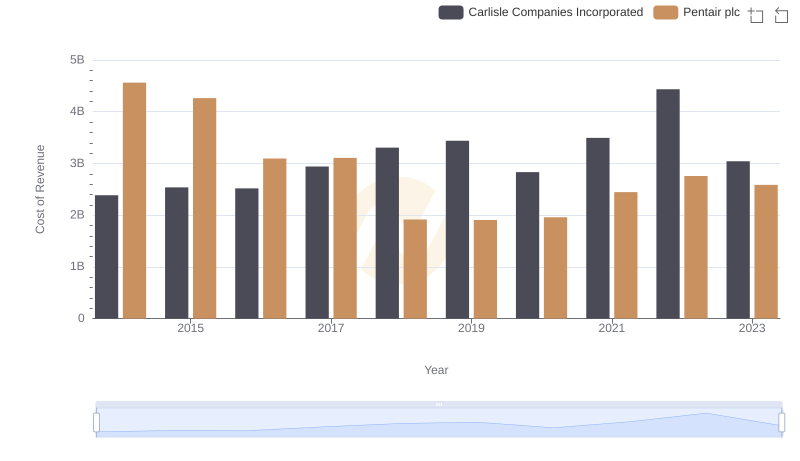
Comparing Cost of Revenue Efficiency: Carlisle Companies Incorporated vs Pentair plc
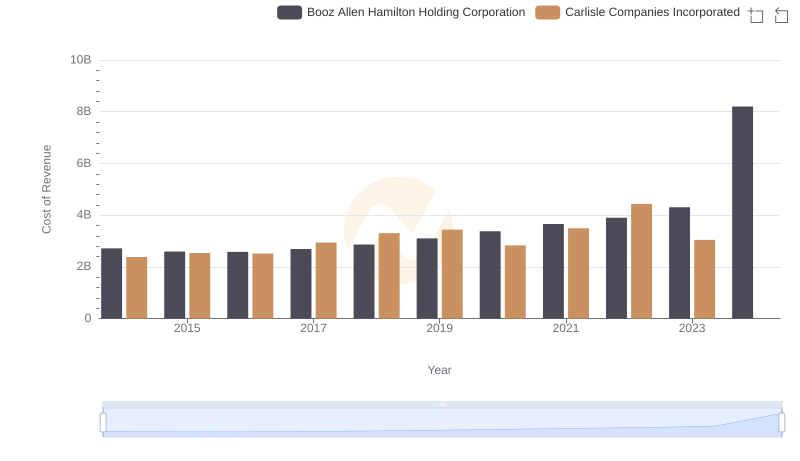
Analyzing Cost of Revenue: Carlisle Companies Incorporated and Booz Allen Hamilton Holding Corporation
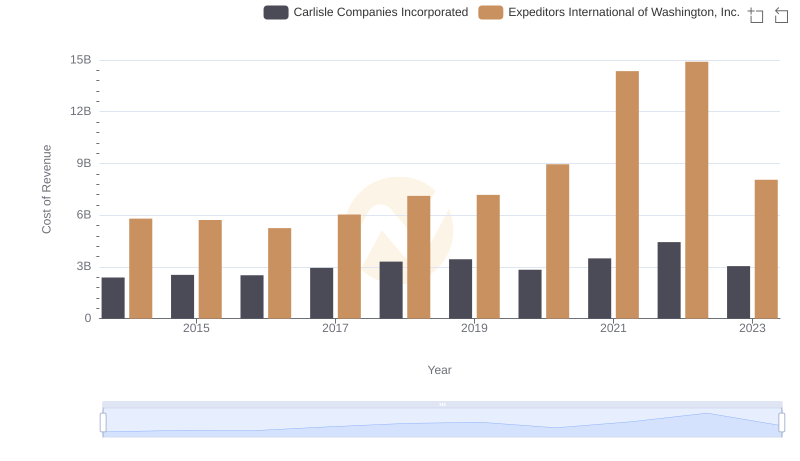
Cost Insights: Breaking Down Carlisle Companies Incorporated and Expeditors International of Washington, Inc.'s Expenses
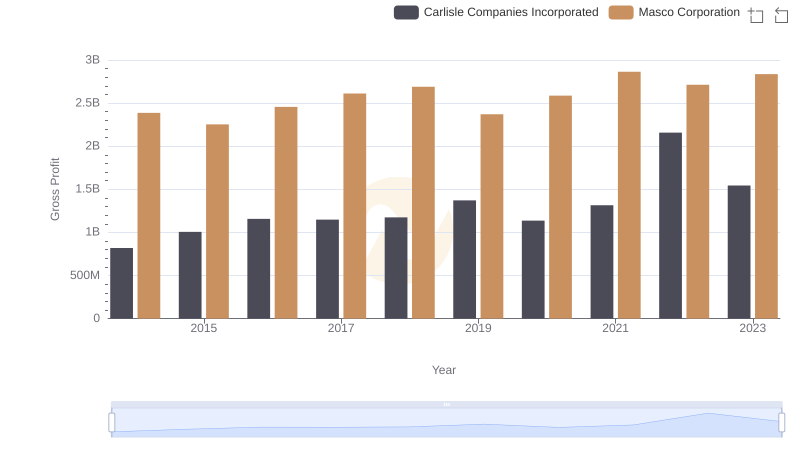
Gross Profit Trends Compared: Carlisle Companies Incorporated vs Masco Corporation
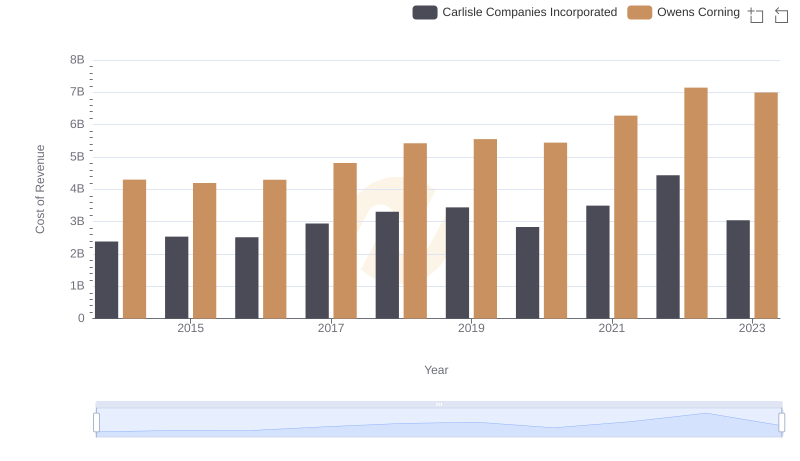
Cost of Revenue Trends: Carlisle Companies Incorporated vs Owens Corning

Cost Management Insights: SG&A Expenses for Carlisle Companies Incorporated and Masco Corporation
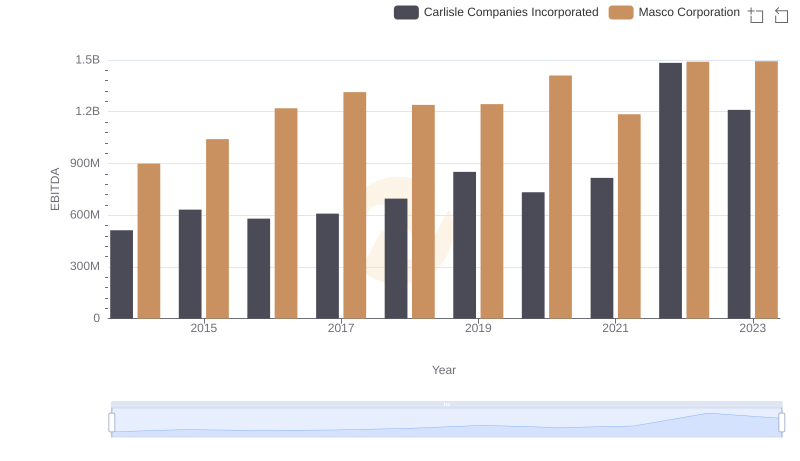
A Professional Review of EBITDA: Carlisle Companies Incorporated Compared to Masco Corporation