| __timestamp | 3M Company | XPO Logistics, Inc. |
|---|---|---|
| Wednesday, January 1, 2014 | 16447000000 | 1975000000 |
| Thursday, January 1, 2015 | 15383000000 | 6538400000 |
| Friday, January 1, 2016 | 15040000000 | 12480100000 |
| Sunday, January 1, 2017 | 16001000000 | 13101100000 |
| Monday, January 1, 2018 | 16682000000 | 14738000000 |
| Tuesday, January 1, 2019 | 17136000000 | 13982000000 |
| Wednesday, January 1, 2020 | 16605000000 | 13689000000 |
| Friday, January 1, 2021 | 18795000000 | 10812000000 |
| Saturday, January 1, 2022 | 19232000000 | 6491000000 |
| Sunday, January 1, 2023 | 18477000000 | 6974000000 |
| Monday, January 1, 2024 | 14447000000 | 7157000000 |
Infusing magic into the data realm
In the ever-evolving landscape of American industry, the cost of revenue is a critical metric that reflects a company's operational efficiency. From 2014 to 2023, 3M Company and XPO Logistics, Inc. have showcased contrasting trajectories in this regard.
3M Company, a stalwart in the manufacturing sector, has consistently maintained a higher cost of revenue, peaking in 2022 with a 17% increase from 2014. This reflects its expansive operations and diverse product lines. In contrast, XPO Logistics, Inc., a leader in transportation and logistics, saw its cost of revenue soar by over 600% from 2014 to 2018, before stabilizing. This dramatic rise underscores its aggressive growth strategy during that period.
Interestingly, 2023 data reveals a decline for both companies, hinting at potential strategic shifts or market challenges. Missing data for 2024 suggests a need for cautious interpretation of future trends.
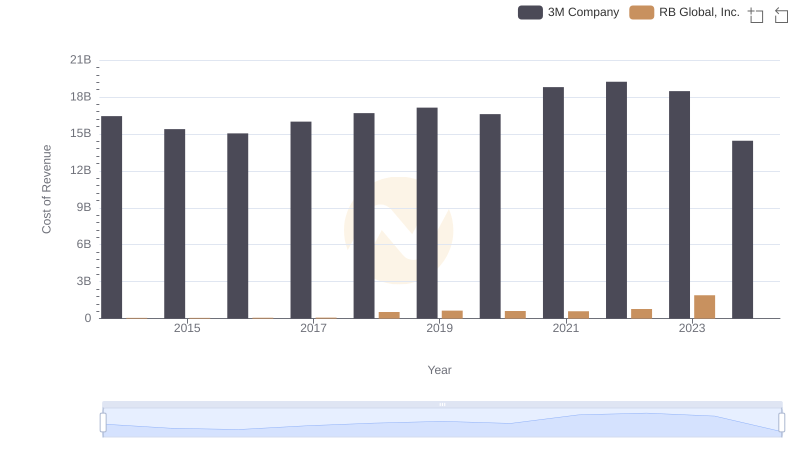
3M Company vs RB Global, Inc.: Efficiency in Cost of Revenue Explored
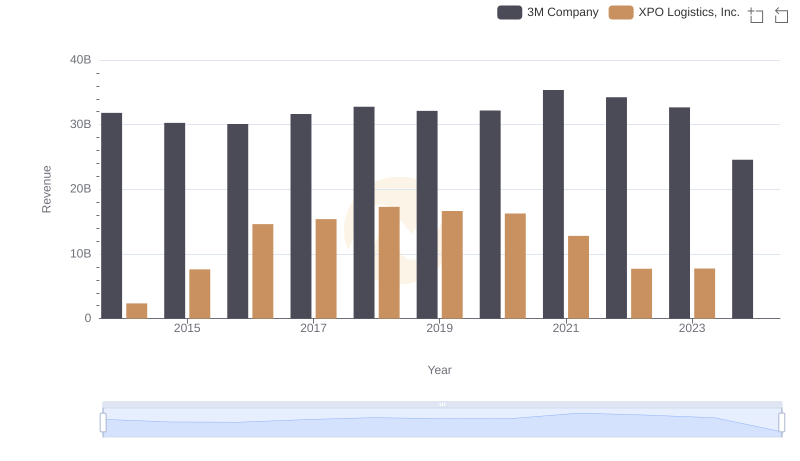
Breaking Down Revenue Trends: 3M Company vs XPO Logistics, Inc.
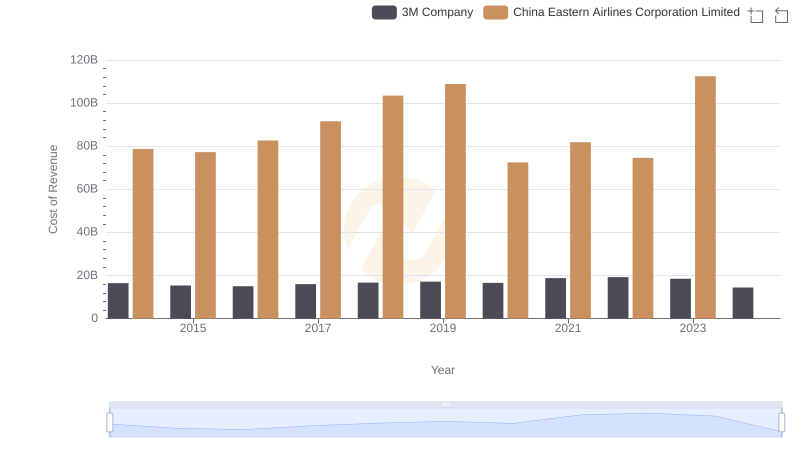
Cost of Revenue Comparison: 3M Company vs China Eastern Airlines Corporation Limited
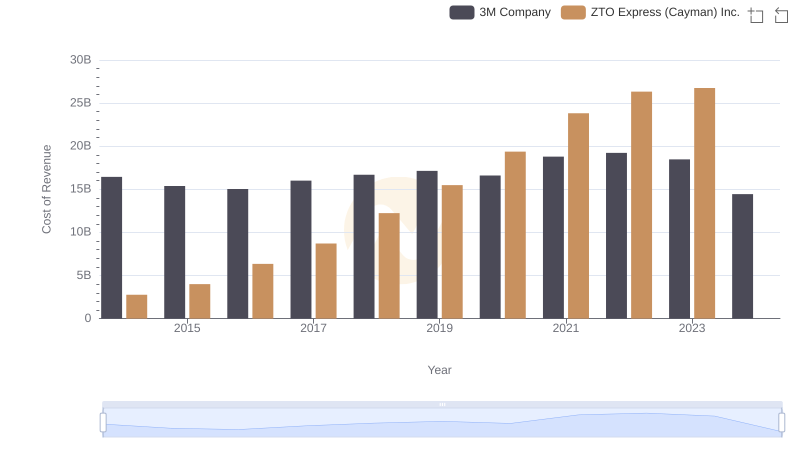
Cost of Revenue Comparison: 3M Company vs ZTO Express (Cayman) Inc.
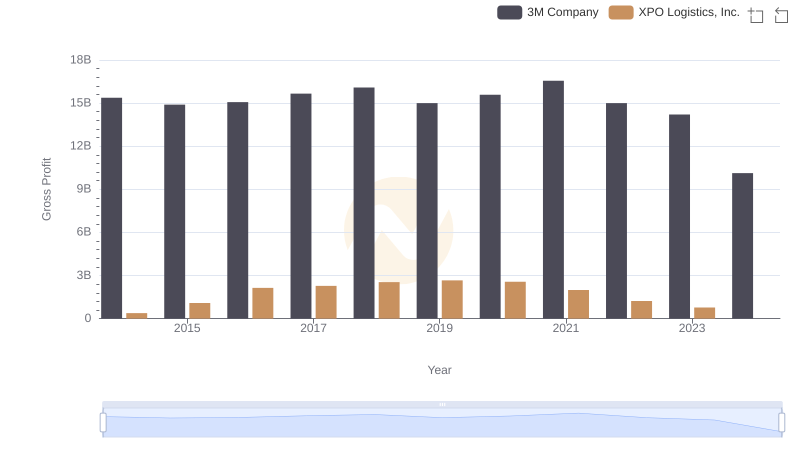
3M Company and XPO Logistics, Inc.: A Detailed Gross Profit Analysis