| __timestamp | Johnson Controls International plc | RTX Corporation |
|---|---|---|
| Wednesday, January 1, 2014 | 42828000000 | 65100000000 |
| Thursday, January 1, 2015 | 37179000000 | 56098000000 |
| Friday, January 1, 2016 | 20837000000 | 57244000000 |
| Sunday, January 1, 2017 | 30172000000 | 59837000000 |
| Monday, January 1, 2018 | 31400000000 | 66501000000 |
| Tuesday, January 1, 2019 | 23968000000 | 77046000000 |
| Wednesday, January 1, 2020 | 22317000000 | 56587000000 |
| Friday, January 1, 2021 | 23668000000 | 64388000000 |
| Saturday, January 1, 2022 | 25299000000 | 67074000000 |
| Sunday, January 1, 2023 | 26793000000 | 68920000000 |
| Monday, January 1, 2024 | 22952000000 | 80738000000 |
Infusing magic into the data realm
In the ever-evolving landscape of global business, RTX Corporation and Johnson Controls International plc stand as titans in their respective fields. Over the past decade, these companies have showcased intriguing revenue trends that reflect broader market dynamics.
From 2014 to 2024, RTX Corporation has demonstrated a robust growth trajectory, with revenue peaking at approximately $80.7 billion in 2024. This represents a remarkable 24% increase from its 2014 figures. Despite a dip in 2015, RTX's revenue has consistently climbed, underscoring its resilience and strategic market positioning.
Conversely, Johnson Controls International plc has experienced more volatility. Starting at a high in 2014, its revenue saw a significant drop by 2016, followed by a gradual recovery. By 2023, the company managed to stabilize its revenue around $26.8 billion, reflecting a strategic recalibration in response to market challenges.
These trends not only highlight the companies' adaptability but also offer insights into the broader economic forces at play.
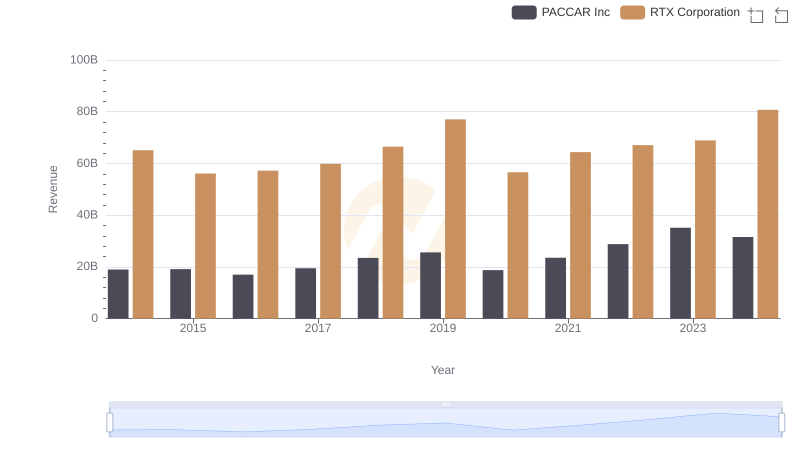
RTX Corporation vs PACCAR Inc: Examining Key Revenue Metrics
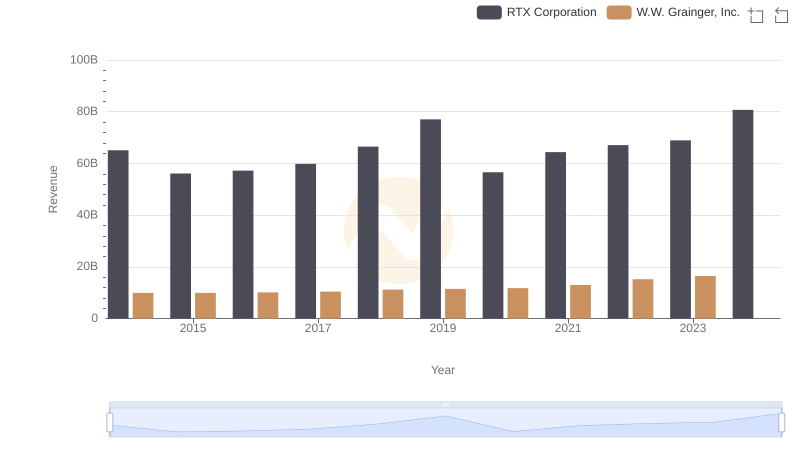
Revenue Insights: RTX Corporation and W.W. Grainger, Inc. Performance Compared
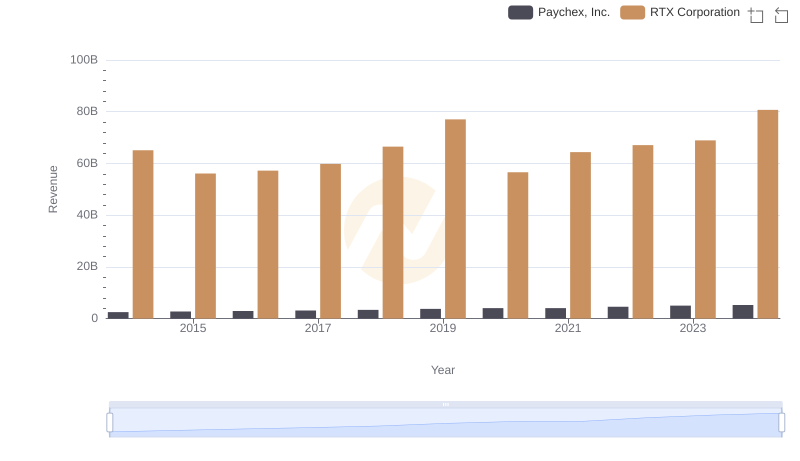
Who Generates More Revenue? RTX Corporation or Paychex, Inc.
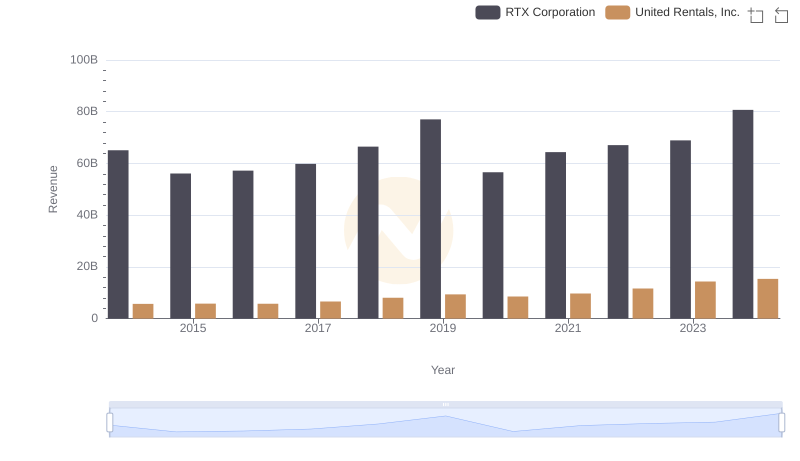
Annual Revenue Comparison: RTX Corporation vs United Rentals, Inc.

Cost Insights: Breaking Down RTX Corporation and Johnson Controls International plc's Expenses
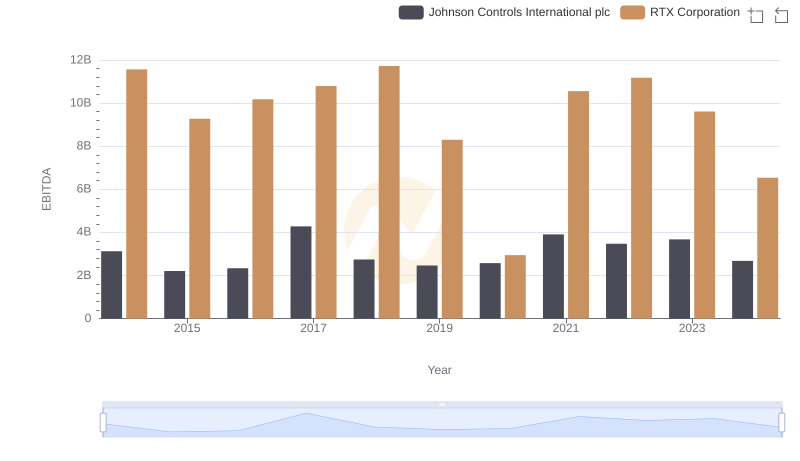
EBITDA Analysis: Evaluating RTX Corporation Against Johnson Controls International plc